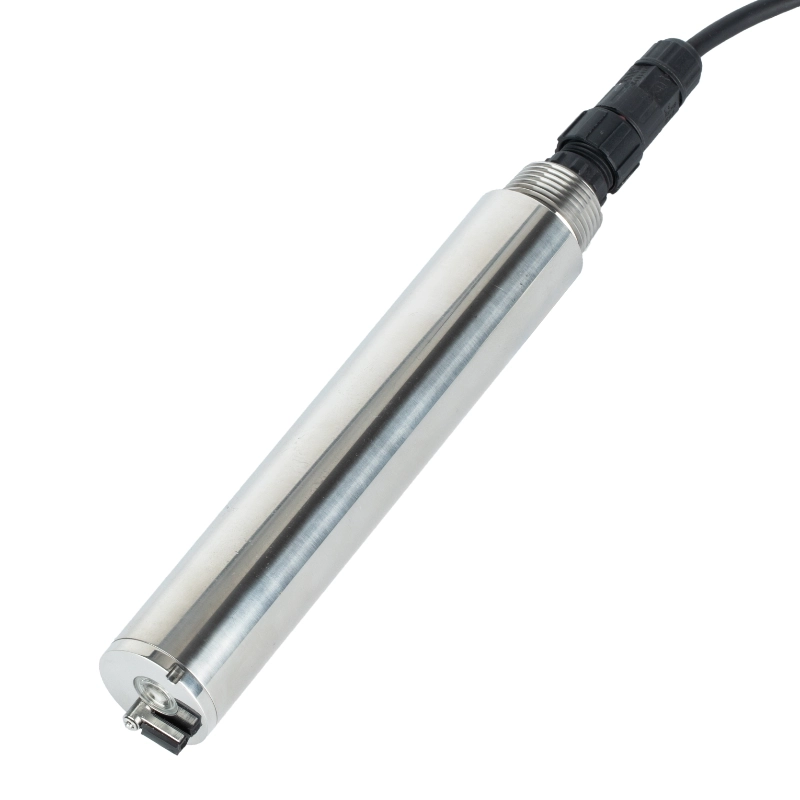
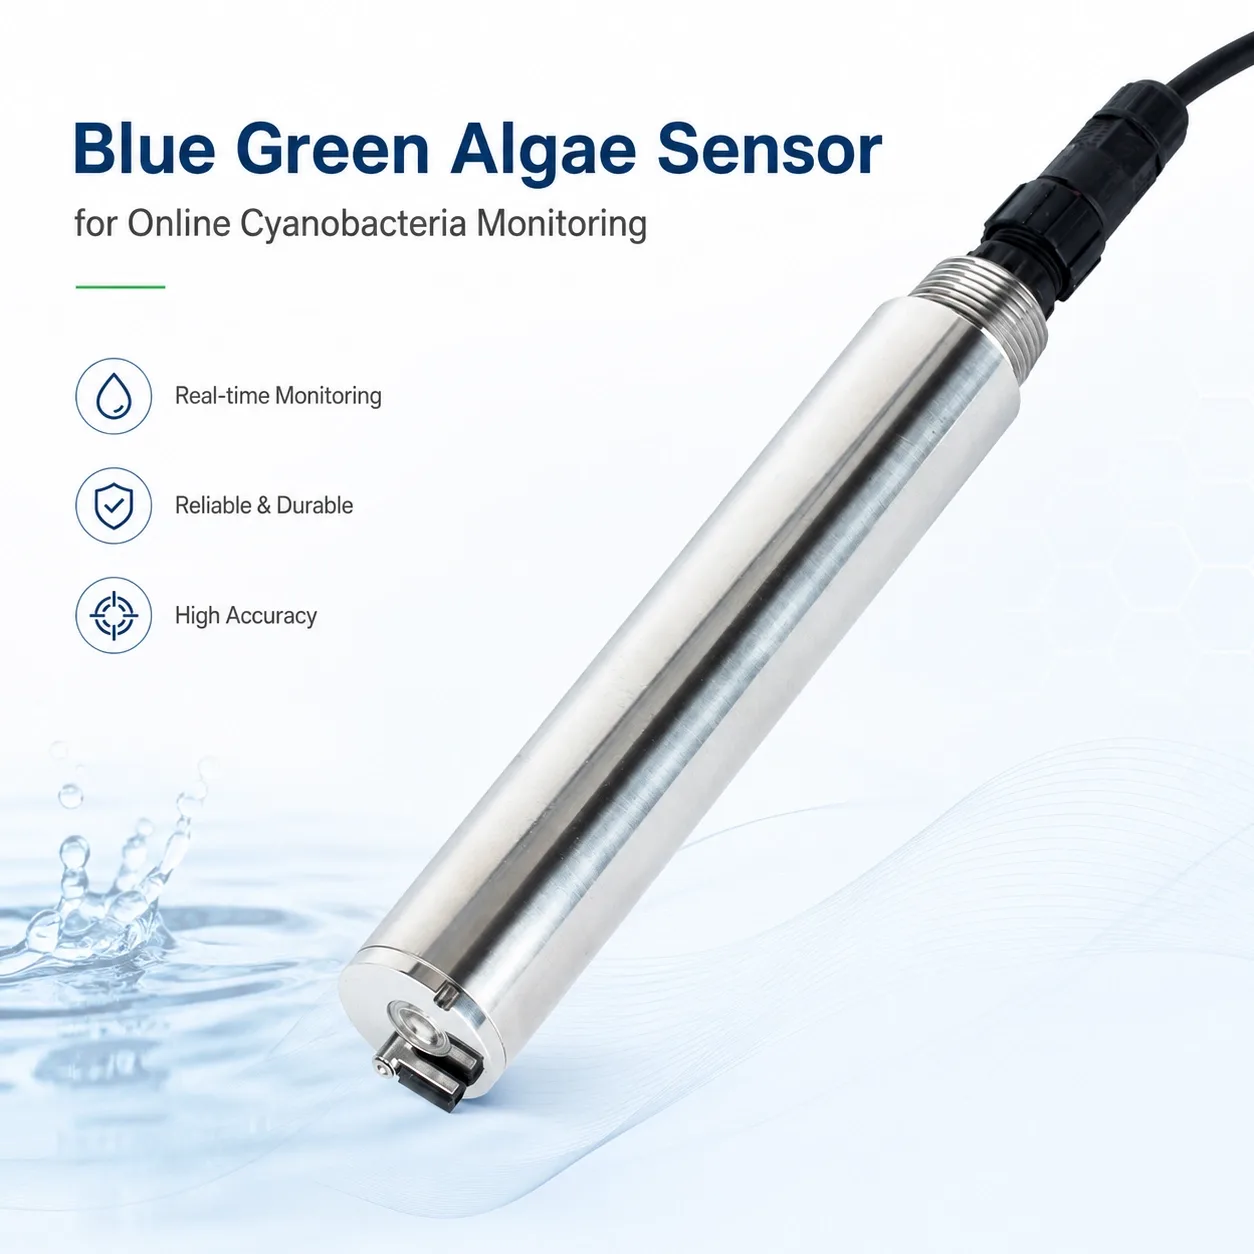
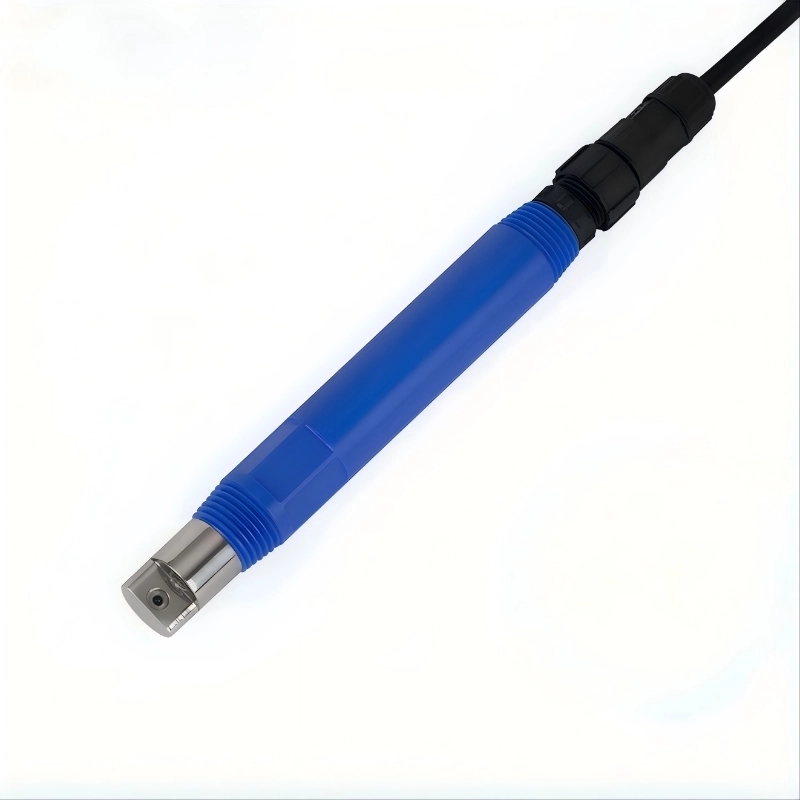
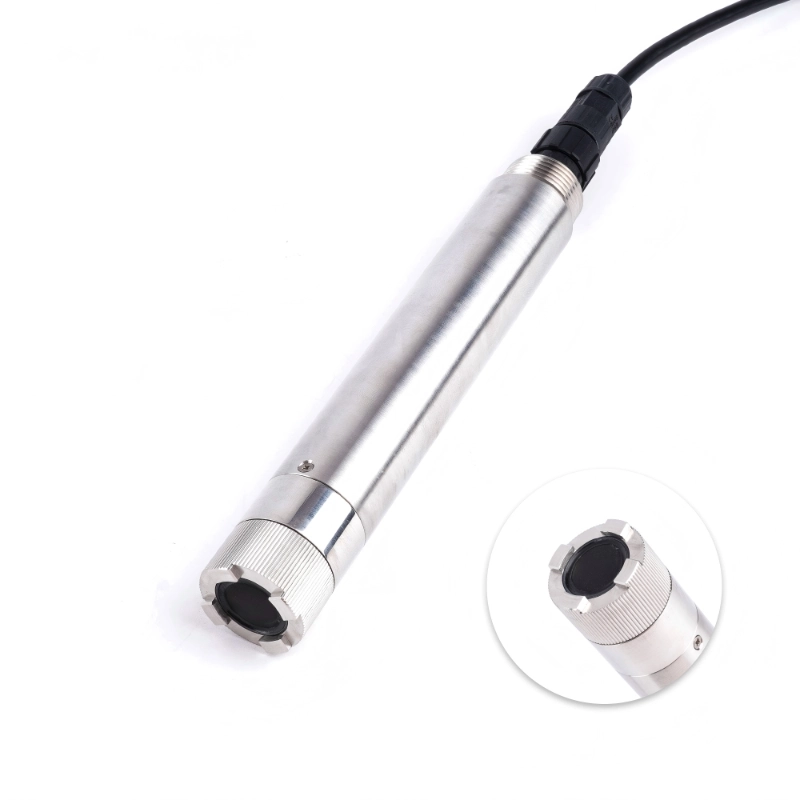
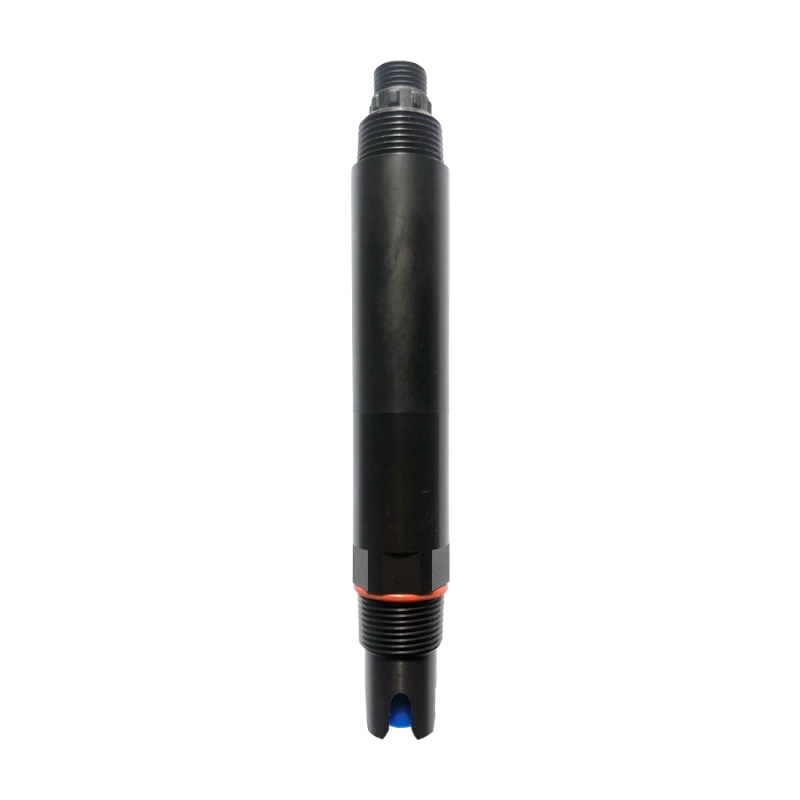
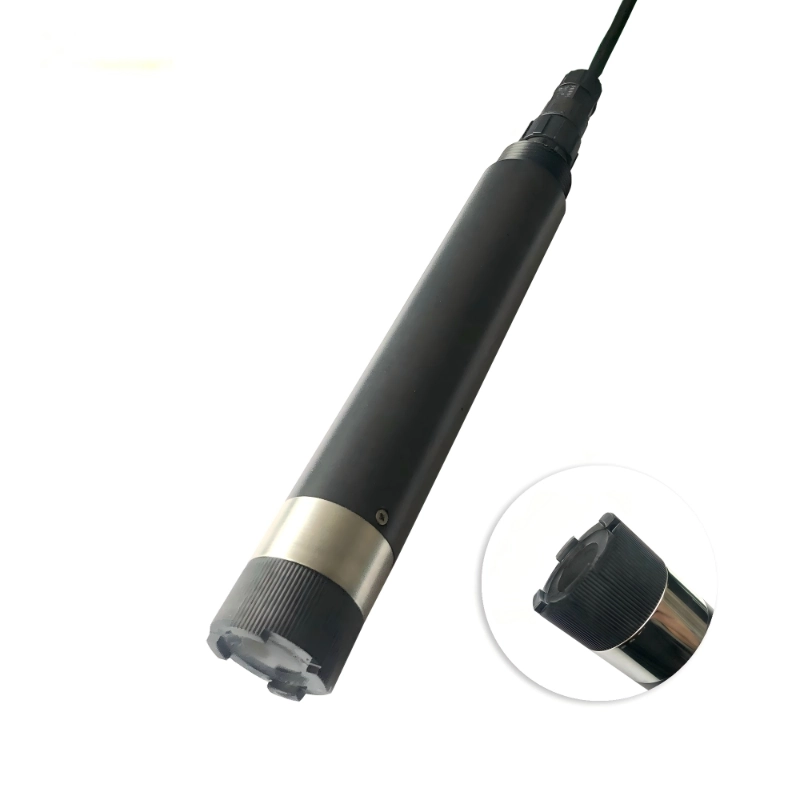
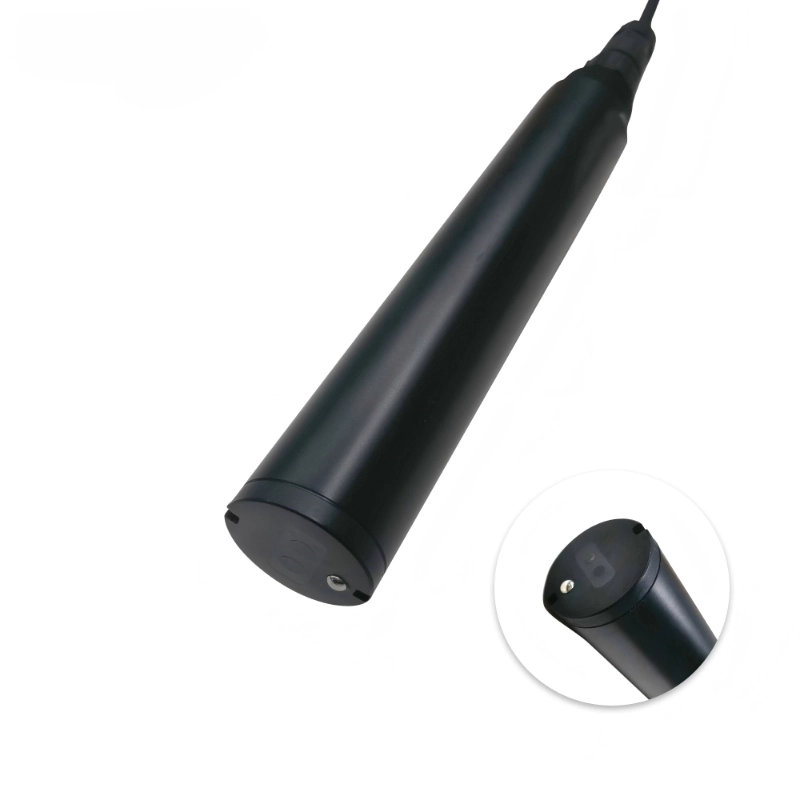
The JW-BGA-408(K17) Blue Green Algae Sensor is an optical water quality sensor designed for continuous monitoring of blue-green algae and cyanobacteria in lakes, reservoirs, rivers, ponds, aquaculture facilities, marine bays, and environmental water monitoring projects.
Using the fluorescence measurement method, the sensor detects changes in blue-green algae concentration directly in the water without requiring frequent manual sampling.
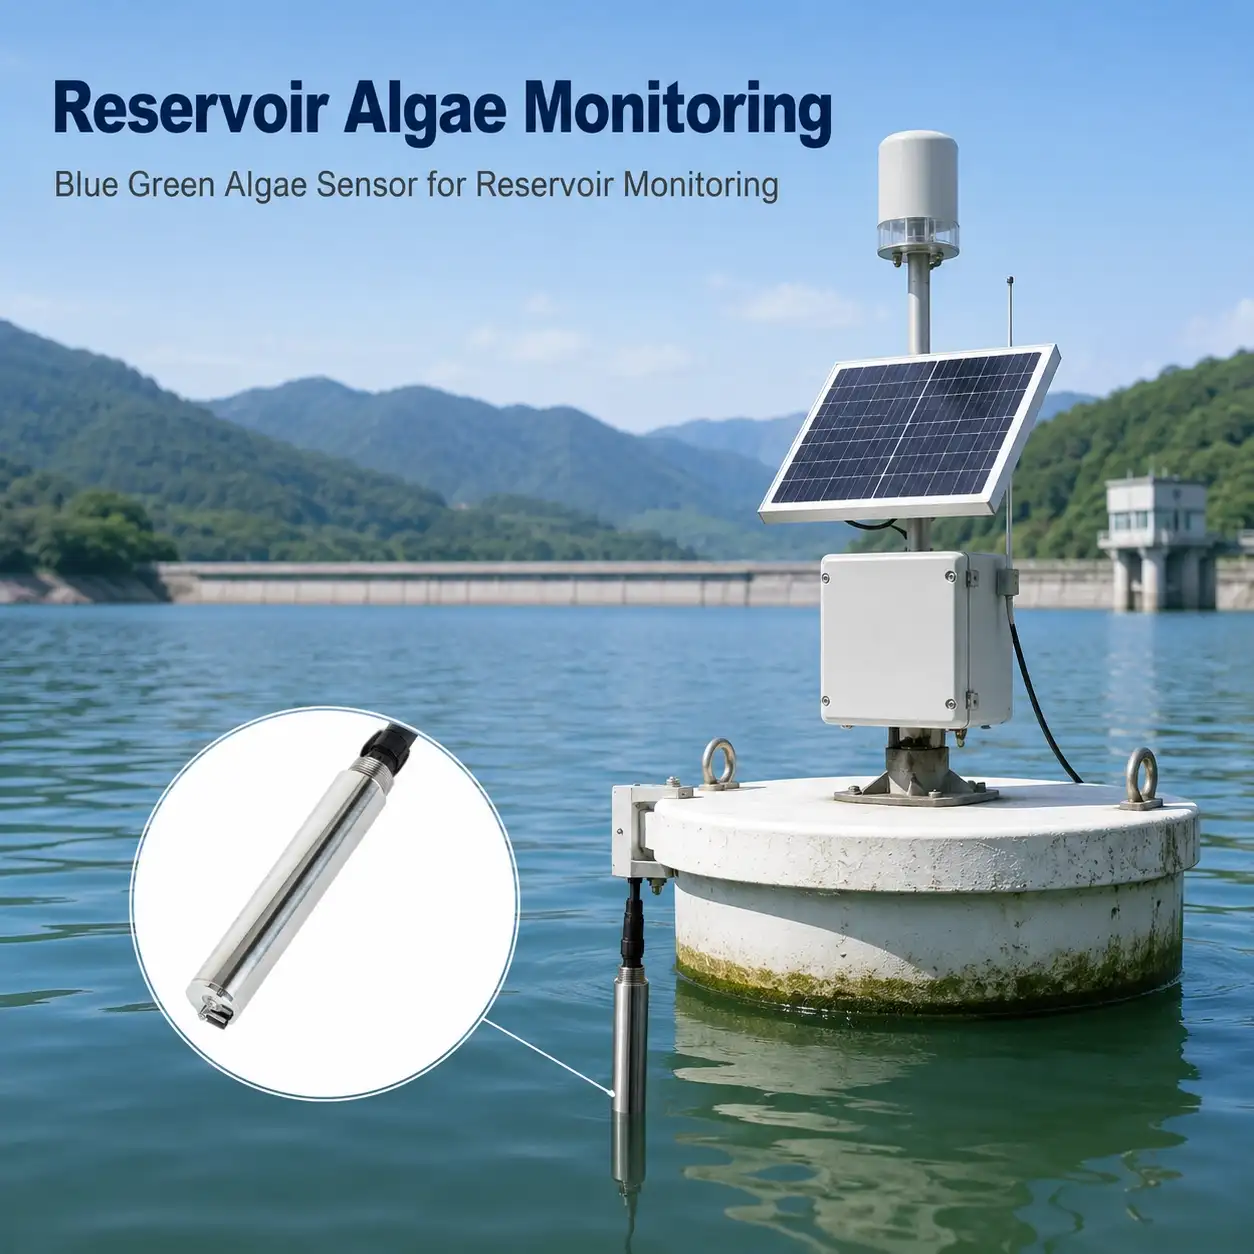
With a measuring range of 0–300.0 Kcells/mL, RS485 Modbus RTU communication, automatic temperature compensation, and IP68 protection, the sensor can be integrated into fixed water quality monitoring stations, buoys, IoT data loggers, telemetry systems, and remote environmental monitoring networks.
For projects requiring several water quality parameters, the blue-green algae sensor can also be combined with pH, dissolved oxygen, conductivity, turbidity, chlorophyll, ammonia nitrogen, and other sensors to create a complete online monitoring system.
A blue green algae sensor, also commonly referred to as a cyanobacteria sensor, is an optical instrument used to continuously estimate the concentration of cyanobacteria in water.
Blue-green algae are actually cyanobacteria rather than conventional algae. Under favorable environmental conditions such as elevated nutrient concentrations, warm water, stable water columns, and sufficient sunlight, cyanobacteria populations may increase rapidly.
Continuous monitoring therefore provides an important additional data source for:
Reservoir water quality management
Lake and river monitoring
Harmful algal bloom surveillance
Drinking-water source monitoring
Aquaculture water management
Environmental research
Surface-water monitoring networks
Unlike periodic manual sampling, an online sensor can provide higher-frequency measurements and help operators identify changing algae conditions between laboratory sampling events.
Why Monitor Cyanobacteria and Blue-Green Algae?
Rapid growth of cyanobacteria can be associated with changes in water quality and ecosystem conditions.
Conventional water sampling remains important for laboratory identification and confirmation, but occasional samples may not fully represent short-term changes across a water body.
Continuous blue-green algae monitoring can help project operators:
Detect Changes Earlier
Continuous measurements make it easier to identify a rapid increase in blue-green algae concentration.
Track Long-Term Trends
Historical sensor data can be used to compare algae conditions between seasons, locations, rainfall events, temperatures, or reservoir operating conditions.
Improve Monitoring Frequency
An online sensor can collect data at much shorter intervals than conventional manual sampling.
Support Multi-Parameter Analysis
Blue-green algae data can be compared with:
Water temperature
Chlorophyll
Dissolved oxygen
pH
Turbidity
Conductivity
Ammonia nitrogen
Nitrate
Meteorological conditions
This provides a more complete understanding of water quality dynamics.
How Does the JW-BGA-408 Blue Green Algae Sensor Work?
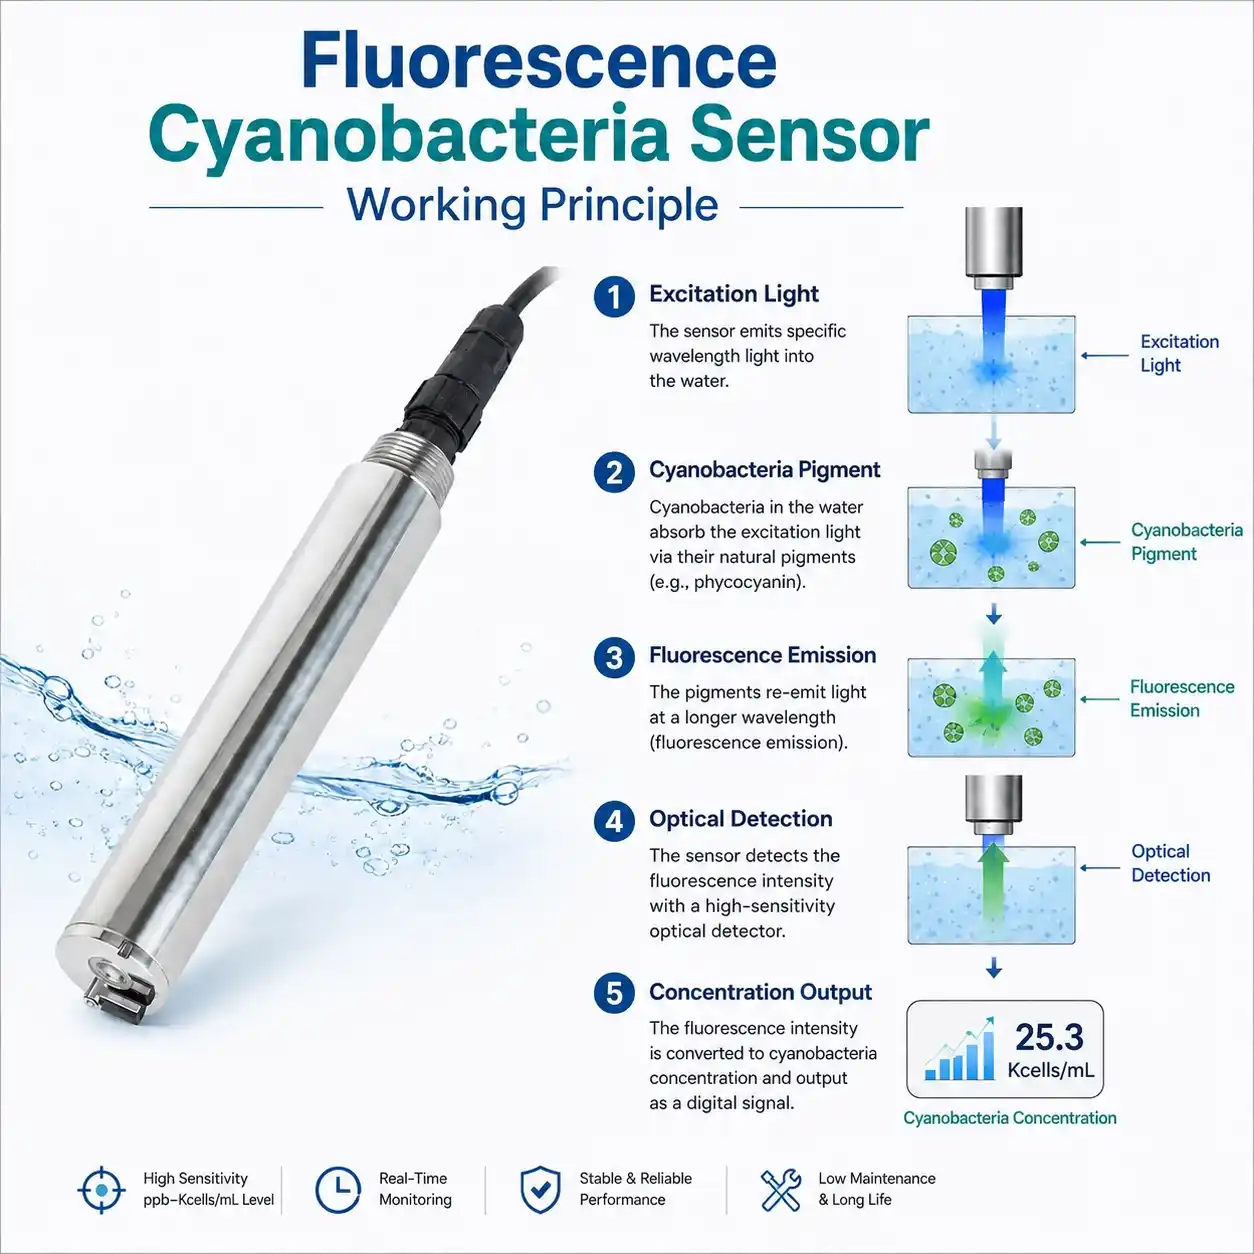
The JW-BGA-408 uses an optical fluorescence measurement principle.
Specific pigments associated with cyanobacteria absorb excitation light at particular wavelengths. After excitation, these pigments emit fluorescence at another wavelength.
The optical detector measures the emitted fluorescence intensity and converts the signal into an estimated blue-green algae concentration.
Because the measurement is performed optically, continuous monitoring can be carried out directly in the water without adding chemical reagents during normal operation.
Technical Specifications
Item
Specification
Product Type
Online Blue Green Algae Sensor
Measurement Principle
Fluorescence method
Measurement Range
0 to 300.0 Kcells/mL
Resolution
0.1 Kcells/mL
Accuracy
±3% of reading
Temperature Accuracy
±0.3°C
Linearity
0.999 R²
Response Time
T90 less than 30 seconds
Minimum Detection Limit
1 Kcells/mL
Calibration Method
Two-point calibration
Cleaning Method
None
Temperature Compensation
Automatic temperature compensation with Pt1000
Output Signal
RS485 Modbus RTU
Optional Output
4 to 20 mA
Storage Temperature
-5 to 65°C
Working Condition
0 to 50°C less than 0.2 MPa
Housing Material
316L stainless steel
Installation Method
Immersion installation 3/4 NPT
Power Consumption
0.2W at 12V
Power Supply
12 to 24V DC
Protection Grade
IP68
Cable
5 core shielded cable
Contact JW-IoT if your project requires complete electrical, communication, installation, or integration specifications.
What Does Kcells/mL Mean?
Kcells/mL means thousands of cells per milliliter.
For example:
1 Kcells/mL = approximately 1,000 cells/mL
10 Kcells/mL = approximately 10,000 cells/mL
100 Kcells/mL = approximately 100,000 cells/mL
The JW-BGA-408 measures blue-green algae over a range of 0 to 300.0 Kcells/mL.
The measured value should normally be interpreted as part of a broader water-quality monitoring strategy rather than as a direct replacement for laboratory cyanobacteria identification or toxin analysis.
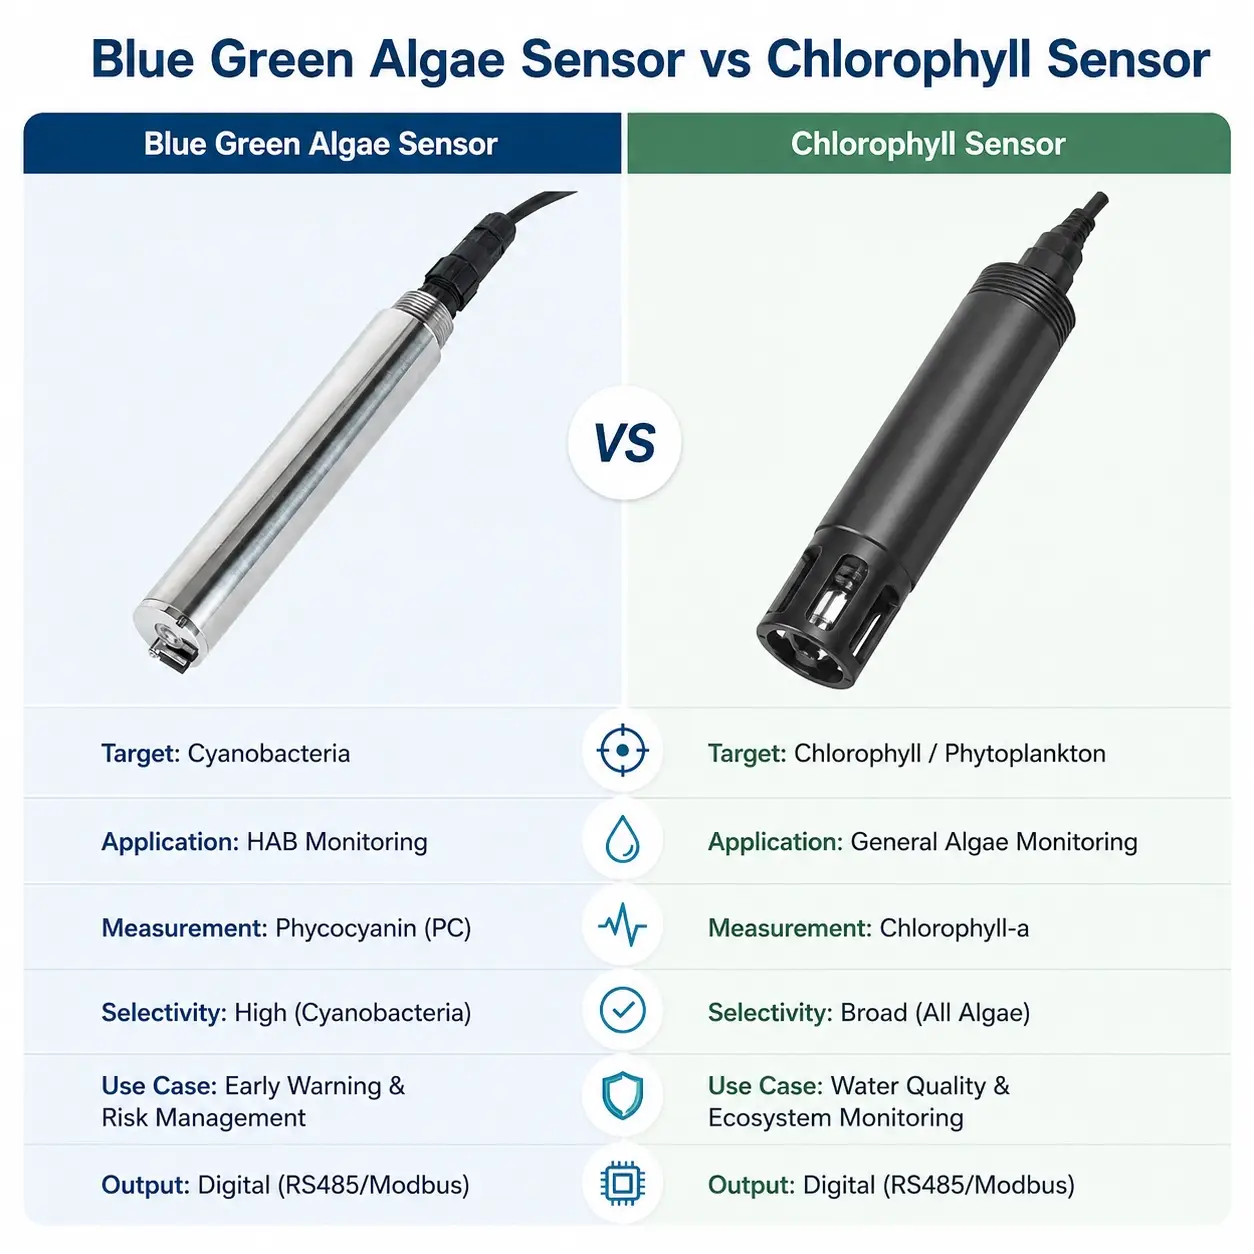
Blue Green Algae Sensor vs Chlorophyll Sensor
Blue-green algae monitoring and chlorophyll monitoring are related, but they are not the same measurement.
Blue Green Algae Sensor
A blue-green algae or cyanobacteria sensor is designed specifically to monitor pigments associated with cyanobacteria.
It is particularly useful when the monitoring objective includes:
Cyanobacteria concentration
Harmful algal bloom surveillance
Reservoir bloom monitoring
Drinking-water source protection
Aquaculture algae monitoring
Chlorophyll Sensor
A chlorophyll sensor is used to estimate chlorophyll-related phytoplankton biomass and is more representative of overall photosynthetic algae activity.
For ecological monitoring projects, using both parameters can provide more information than relying on either measurement alone.
Reservoirs can experience significant seasonal changes in algae populations because of changes in:
Temperature
Nutrient loading
Rainfall
Water residence time
Solar radiation
Stratification
Upstream runoff
Installing online cyanobacteria sensors at representative monitoring locations can help water-resource managers evaluate changes over time.
A reservoir monitoring system may combine:
Blue Green Algae + Chlorophyll + DO + pH + Turbidity + Conductivity + Water Temperature
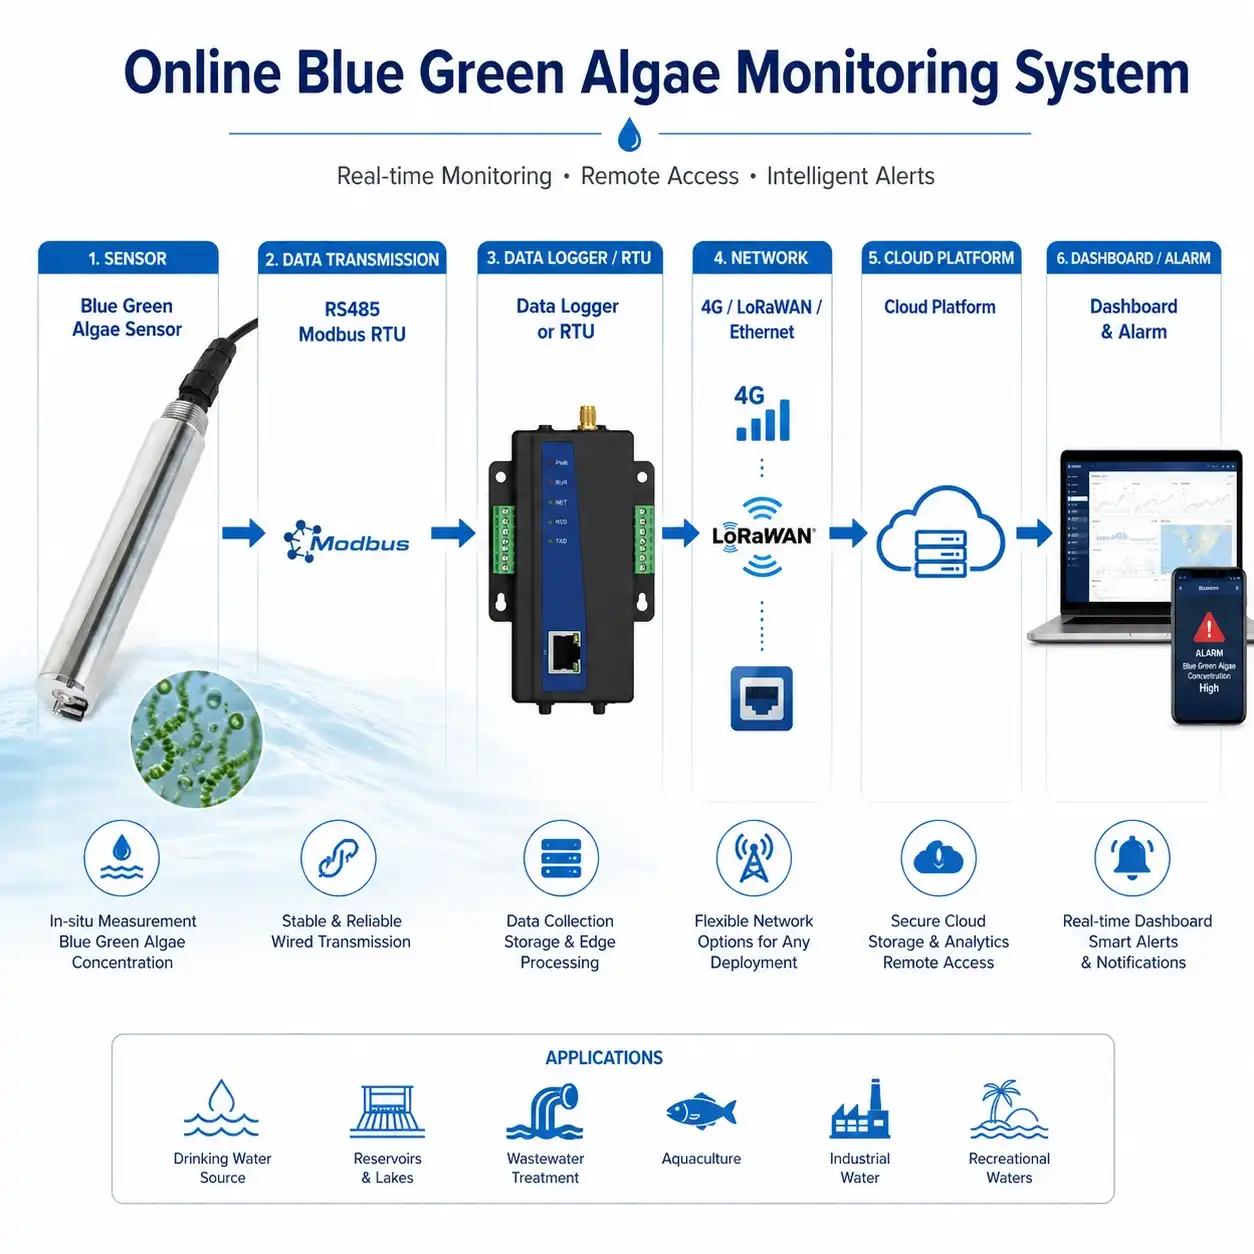
Data can then be transmitted through an RTU or IoT gateway to a remote monitoring platform.
Lake and Pond Monitoring
Lakes and ponds are common locations for algal growth and eutrophication monitoring.
Online algae sensors can be installed at:
Water-quality monitoring stations
Floating buoys
Intake locations
Shore monitoring stations
Ecological observation points
Multiple sensors can also be deployed across a large lake to compare spatial differences.
River Water Quality Monitoring
River conditions can change rapidly after rainfall, agricultural runoff, wastewater discharge, or changes in upstream flow.
An online blue-green algae sensor can form part of a river monitoring station together with conventional physical and chemical water-quality sensors.
Continuous data helps environmental teams compare biological water-quality indicators with hydrological and chemical changes.
Drinking Water Source Monitoring
Reservoirs, lakes, and rivers used as drinking-water sources may require enhanced monitoring for cyanobacteria.
Installing a sensor upstream or near a water intake can provide an additional continuous indicator between manual sampling events.
A typical source-water monitoring station may include:
Blue-green algae
Chlorophyll
Turbidity
pH
Dissolved oxygen
Conductivity
Temperature
Ammonia nitrogen
Sensor measurements should be combined with appropriate laboratory analysis and local water-quality management procedures when regulatory decisions are required.
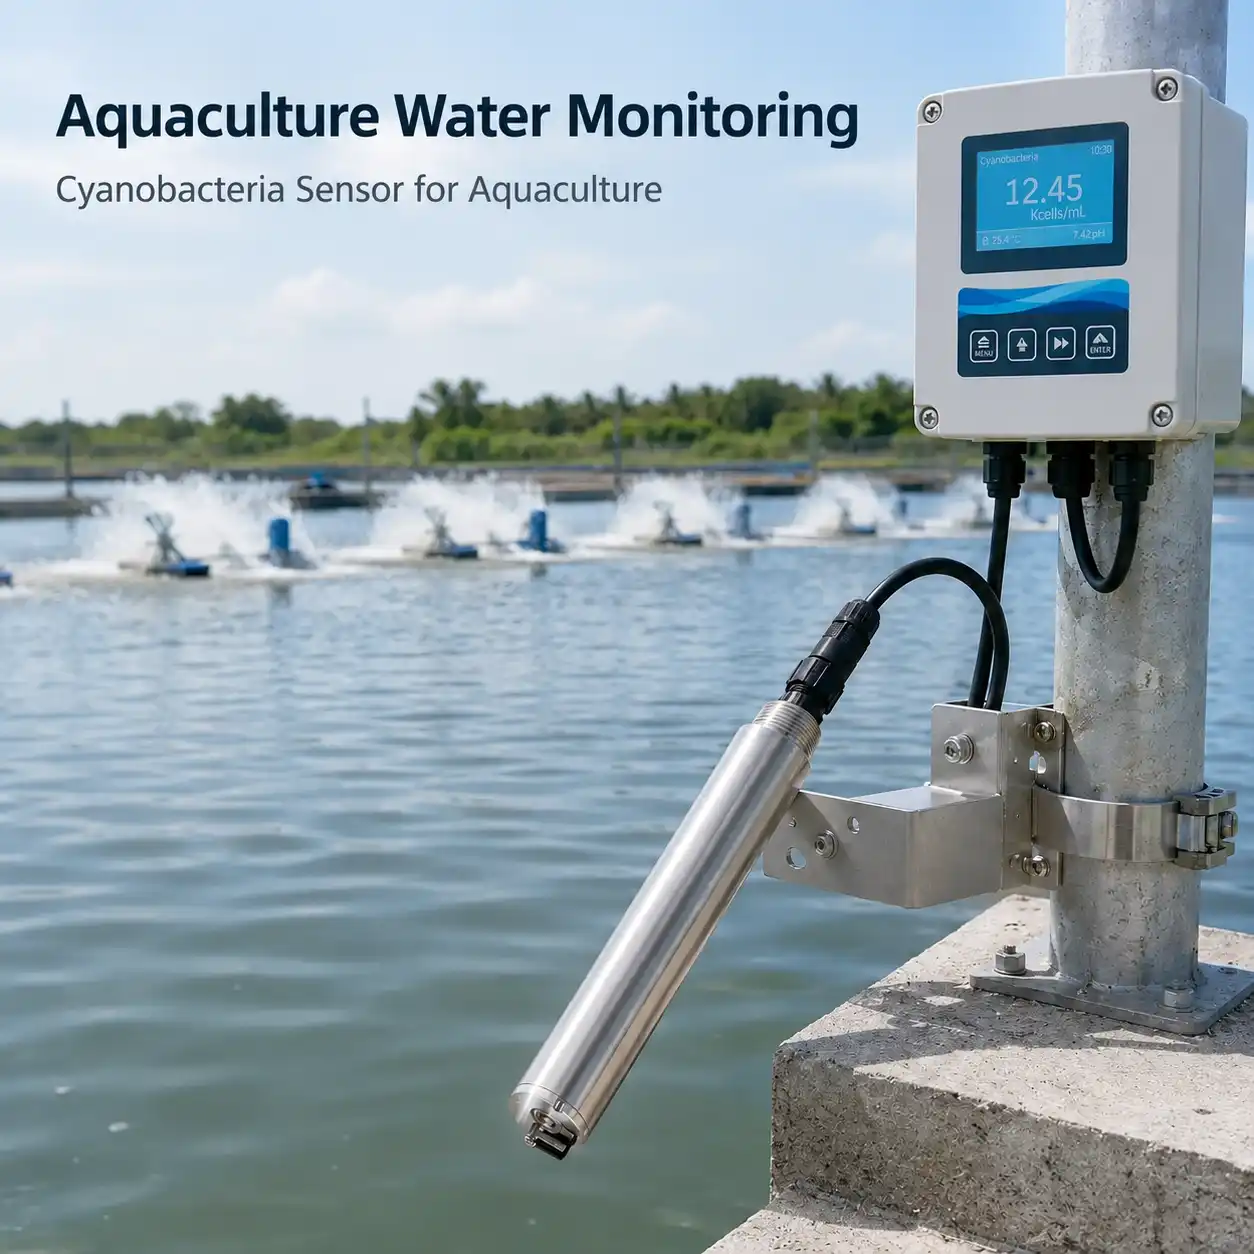
Aquaculture Water Monitoring
Algae are an important part of many aquaculture ecosystems, but excessive or rapidly changing algae conditions can affect water quality.
The JW-BGA-408 can be used in:
Fish ponds
Shrimp farms
Recirculating aquaculture systems
Reservoir aquaculture
Intensive pond farming
For aquaculture applications, blue-green algae measurements can be evaluated together with:
Dissolved oxygen
pH
Temperature
Salinity
Conductivity
Turbidity
Ammonia nitrogen
This helps farm operators observe water-quality trends remotely and respond to abnormal changes more efficiently.
Environmental Monitoring and Research
Continuous blue-green algae measurement is also suitable for:
Watershed monitoring
Ecological research
Eutrophication studies
Wetland monitoring
Environmental impact projects
Algal bloom studies
Smart water monitoring networks
High-frequency data can provide additional temporal information that is difficult to obtain using manual sampling alone.
Building an Online Cyanobacteria Monitoring System
The blue-green algae sensor can operate as part of a complete IoT water-quality monitoring architecture.
Blue Green Algae + Chlorophyll + DO + pH + Turbidity + Temperature
Suitable for:
Reservoirs
Lakes
Source water
Ecological monitoring
Configuration B — Aquaculture Monitoring
Recommended parameters:
Blue Green Algae + DO + pH + Temperature + Salinity/EC + Ammonia Nitrogen
Suitable for:
Fish farming
Shrimp ponds
Aquaculture reservoirs
Configuration C — Surface Water Monitoring
Recommended parameters:
Blue Green Algae + Chlorophyll + Turbidity + pH + DO + Conductivity + Temperature
Suitable for:
Rivers
Lakes
Wetlands
Watershed monitoring
JW-IoT can configure the sensor combination according to your target water body, monitoring parameters, communication method, number of sites, and platform requirements.
Installation Recommendations
Correct installation is important for reliable optical measurements.
Keep the Optical Window Submerged
The sensing area should remain continuously immersed during operation.
Avoid Sediment Accumulation
Do not install the optical surface directly against the riverbed, pond bottom, or locations where sediment can easily accumulate.
Select a Representative Monitoring Point
Avoid highly stagnant corners unless the objective is specifically to monitor those locations.
For reservoirs and rivers, consider:
Water flow
Intake position
Depth
Seasonal water-level changes
Sunlight conditions
Algal distribution
Inspect the Optical Surface Regularly
Biofouling, sediment, and other deposits can influence optical measurements.
Inspection and cleaning frequency should therefore be determined according to the actual water conditions.
Verify Field Data
For important projects, sensor readings should periodically be compared with appropriate field or laboratory reference measurements.
Factors That May Affect Blue-Green Algae Measurements
Like other optical water-quality sensors, measurement performance can be influenced by actual environmental conditions.
Possible factors include:
Biofouling
Suspended sediment
Turbidity
Optical window contamination
Bubbles
Different cyanobacteria communities
Changing water temperature
Installation position
Spatial variation in algae distribution
For this reason, monitoring projects should combine proper sensor installation, routine maintenance, historical data analysis, and reference sampling where necessary.
Online Sensor Monitoring vs Laboratory Sampling
Online sensors and laboratory analysis serve different purposes.
Online Blue Green Algae Sensor
Laboratory Analysis
Continuous monitoring
Periodic sampling
High-frequency data
Detailed sample analysis
Rapid trend detection
Species identification possible
Remote monitoring
Requires sampling and analysis
Suitable for alarms
Suitable for confirmation
Supports IoT networks
Supports regulatory or scientific analysis
For many environmental projects, the most effective strategy is to use continuous online sensing for trend detection and laboratory testing for verification and detailed analysis.
How to Select a Blue Green Algae Monitoring System
Before selecting a cyanobacteria monitoring system, define the following project requirements.
1. Water Body
Specify whether the sensor will be used in:
River
Reservoir
Lake
Pond
Aquaculture facility
Marine environment
Drinking-water source
2. Required Parameters
Determine whether blue-green algae will be monitored alone or together with other parameters.
3. Number of Monitoring Points
A single intake monitoring point and a distributed reservoir network require different system architectures.
4. Power Supply
Remote monitoring stations may require independent or solar-powered operation.
5. Communication Method
Confirm whether the site requires:
RS485 connection
Cellular communication
LoRaWAN
Ethernet
Other telemetry methods
6. Platform Integration
Determine whether measurements will be transmitted to:
JW-IoT monitoring platform
Customer SCADA
PLC
Third-party cloud platform
Existing environmental monitoring system
Providing this information allows JW-IoT engineers to recommend a more appropriate monitoring architecture.
Configure Your Blue Green Algae Monitoring System
Planning a cyanobacteria, reservoir, aquaculture, or surface-water monitoring project?
Send JW-IoT your:
Application
Water body
Required monitoring parameters
Number of monitoring locations
Installation depth
Communication method
Power supply
Platform or API requirements
Our team can recommend a sensor combination and monitoring architecture based on your project.
It is used to monitor cyanobacteria, green algae, and microalgae concentrations in lakes, reservoirs, rivers, marine bays, aquaculture farms, and environmental water quality stations.
Q
2. What measurement method does this sensor use?
A
The sensor uses the fluorescence method, measuring emitted light intensity that is proportional to the blue green algae concentration in water.
Q
3. What is the measurement range of the sensor?
A
The sensor measures from 0 to 300.0 Kcells/mL with a resolution of 0.1 Kcells/mL.
Q
4. Can this sensor connect to an IoT monitoring platform?
A
Yes. It supports RS485 Modbus RTU and optional 4 to 20 mA output, making it suitable for PLCs, RTUs, data loggers, gateways, and IoT platforms.
Q
5. How does JW-IoT use this sensor in algal bloom early warning systems?
A
JW-IoT can integrate the blue green algae sensor with IoT gateways, cloud dashboards, threshold alarms, and multi-point monitoring stations for lake, reservoir, and aquaculture bloom early warning.
Q
6. Is this sensor suitable for aquaculture water monitoring?
A
Yes. It can be used in freshwater and seawater aquaculture to monitor algae concentration and support water quality risk management.
Q
7. Can JW-IoT provide a complete water quality monitoring solution with this sensor?
A
Yes. JW-IoT can combine blue green algae, chlorophyll, dissolved oxygen, pH, turbidity, conductivity, temperature, and water level sensors into a complete smart water monitoring system.
Q
8. What installation distance should be maintained?
A
The sensor should be installed at least 5 cm away from side walls and at least 20 cm away from the bottom to reduce measurement interference.
Q
9. Can JW-IoT customize system integration for different projects?
A
Yes. JW-IoT can support RS485 Modbus integration, optional 4 to 20 mA output, gateway connection, dashboard configuration, and multi-site monitoring according to project requirements.
 +86 13520127780
  info@jingelway.com