+86 13520127780
  info@jingelway.com








How Continuous Cyanobacteria Monitoring Helps Detect Harmful Algal Bloom Risk Earlier
Release time: 2026-08-25
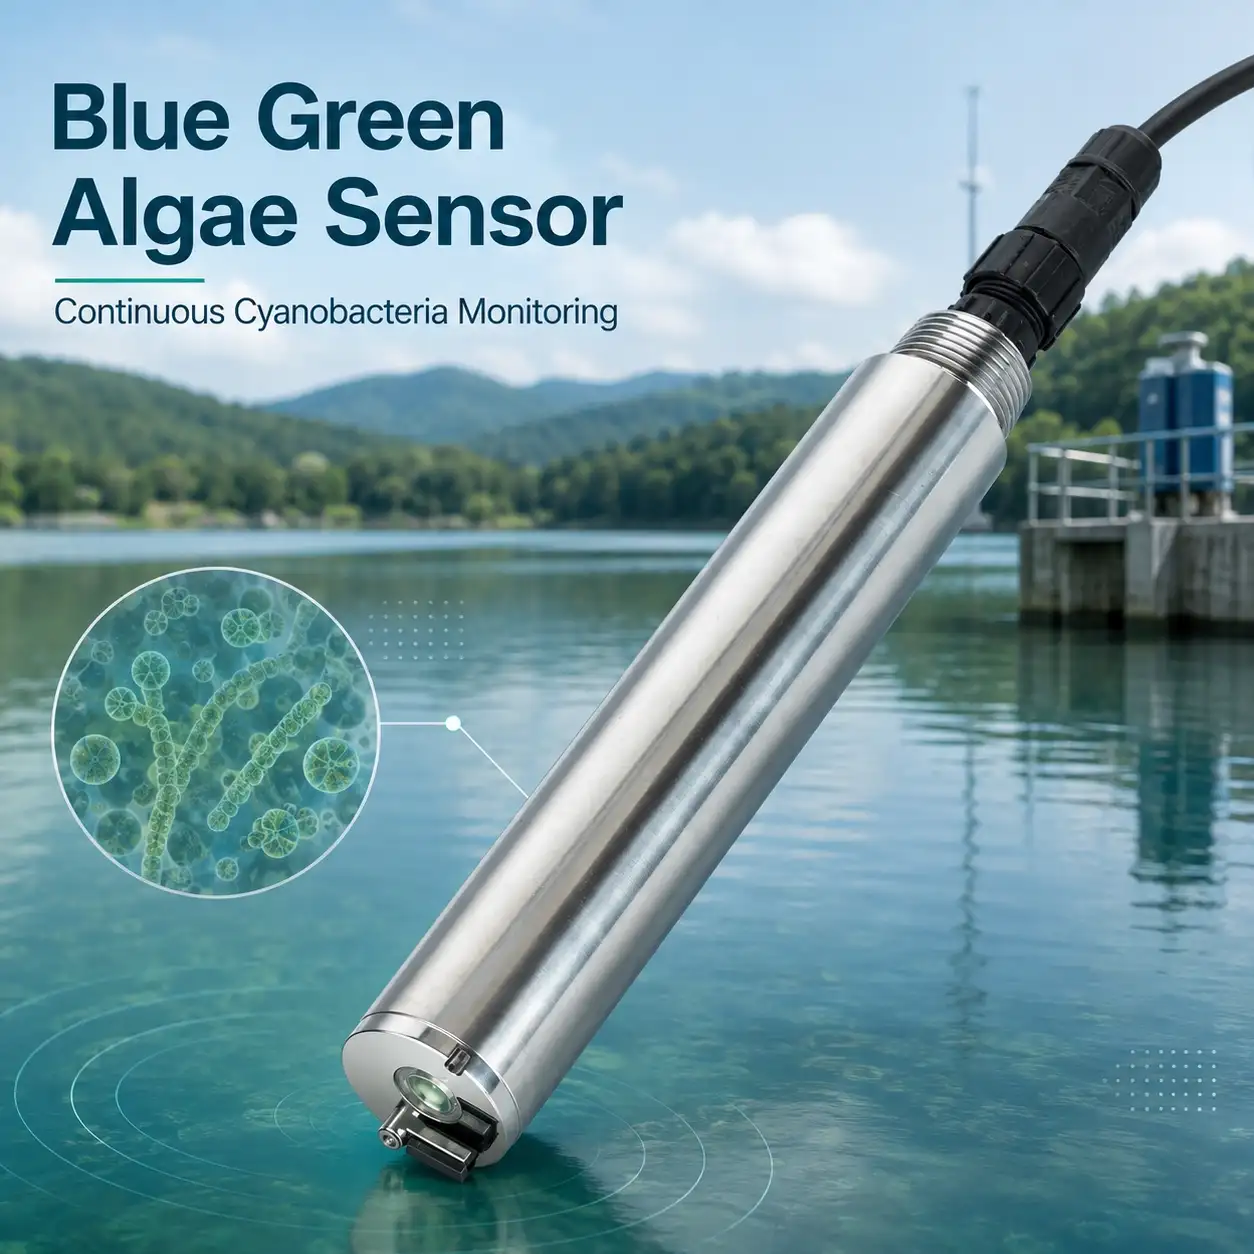
Cyanobacteria Monitoring Is More Than Detecting Green Water
A lake or reservoir can appear normal one week and develop significant cyanobacterial activity shortly afterward.
For water utilities, reservoir operators, environmental agencies, aquaculture facilities and research projects, this creates an important monitoring challenge:
How can changes associated with cyanobacteria be detected before a bloom becomes visually obvious?
Traditional water sampling remains important, particularly when species identification or cyanotoxin analysis is required. However, periodic sampling provides measurements only at specific locations and times.
Continuous monitoring adds another layer of information.
By collecting high-frequency data from the water body, operators can identify changes in cyanobacteria-related indicators and other environmental parameters between manual sampling events.
This can help transform monitoring from occasional observation into a more continuous early-warning process.
What Are Cyanobacteria and Why Should They Be Monitored?
Cyanobacteria are photosynthetic microorganisms commonly referred to as blue-green algae.
They occur naturally in freshwater environments including:
- Lakes
- Reservoirs
- Rivers
- Ponds
- Aquaculture waters
- Drinking-water sources
Their presence does not automatically mean that the water is dangerous.
The concern arises when environmental conditions support rapid cyanobacterial growth and the development of cyanobacterial harmful algal blooms, or CyanoHABs.
Depending on the species and environmental conditions, some cyanobacteria may produce toxins. Blooms can also contribute to operational problems such as taste and odor issues, reduced water clarity, oxygen fluctuations and changes in aquatic ecosystems.
This is why an effective monitoring program usually looks not only at whether cyanobacteria are present, but also at how their abundance is changing over time.
Why Periodic Sampling Alone May Miss Rapid Changes
Imagine a reservoir sampled every Monday morning.
The laboratory results may provide highly valuable information about the conditions at that moment.
But what happens on Tuesday, Wednesday or Thursday?
Cyanobacterial populations can respond to changing environmental conditions between sampling events. Weather, water temperature, nutrient availability, stratification and hydrodynamic conditions may all influence bloom development.
Periodic sampling therefore answers:
“What was happening when we collected this sample?”
Continuous monitoring can help answer a different question:
“How has the water been changing since the last sample?”
The two approaches should not necessarily compete with each other.
A stronger monitoring strategy often combines:
Continuous sensors → trend detection → targeted sampling → laboratory confirmation → management response
This makes continuous monitoring particularly useful as a screening and early-warning layer.
What Does a Cyanobacteria Sensor Actually Measure?
One important concept in online cyanobacteria monitoring is phycocyanin.
Phycocyanin is a photosynthetic accessory pigment associated with many freshwater cyanobacteria.
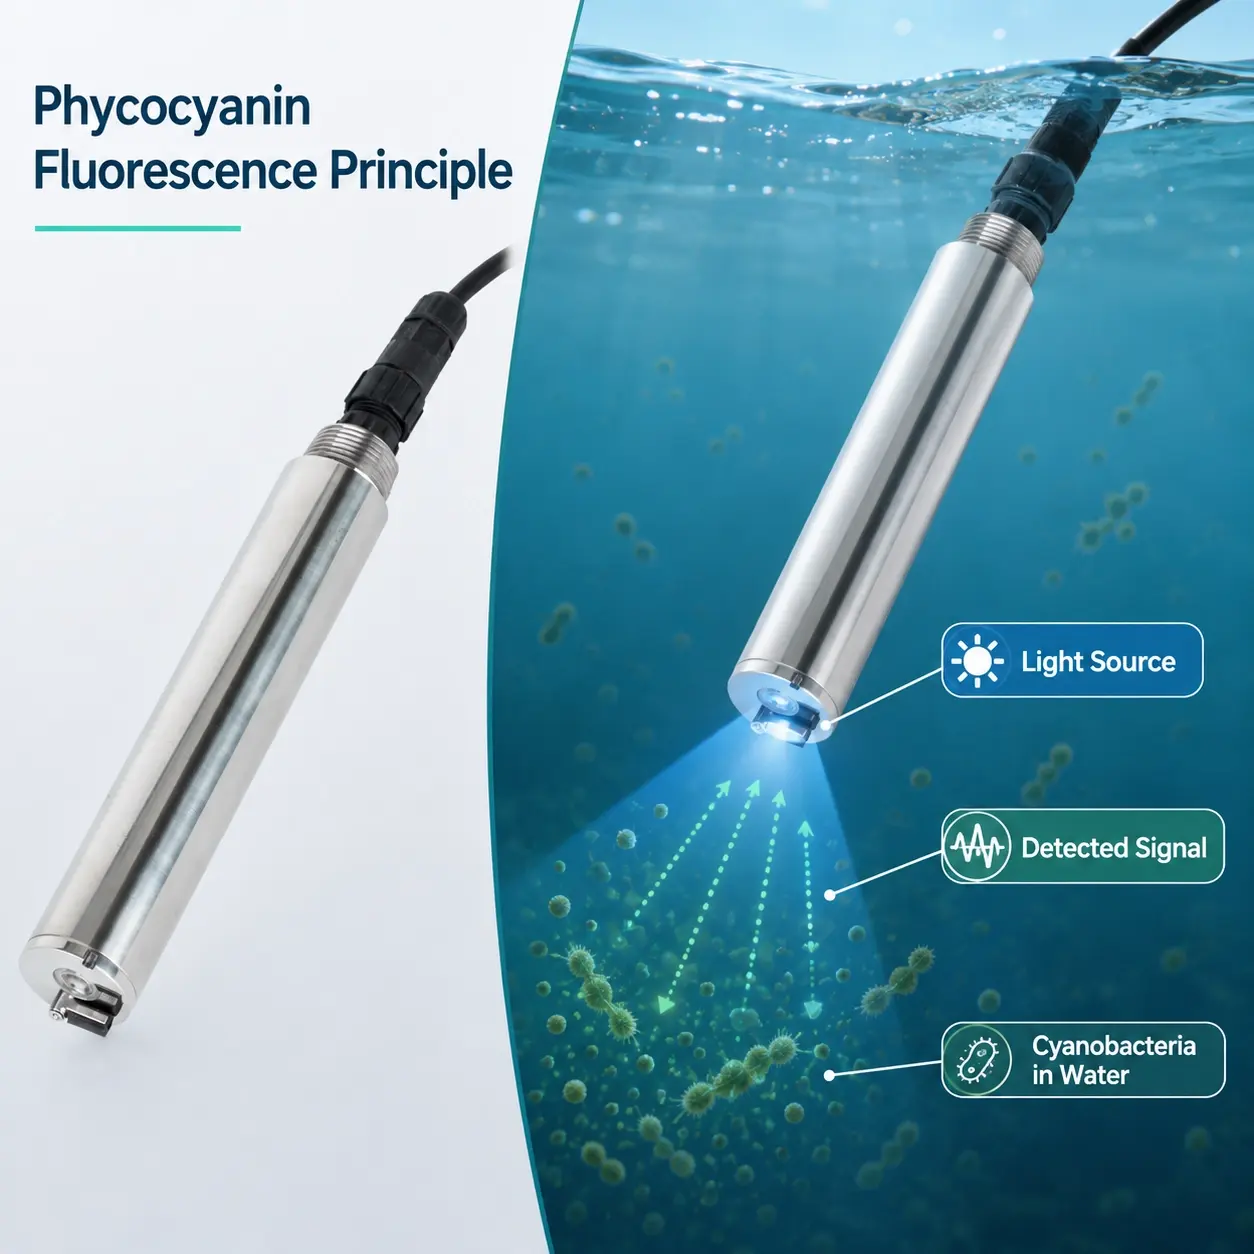
Optical sensors can illuminate the water using selected wavelengths and measure the resulting fluorescence response. Changes in this fluorescence signal can then be used as an indicator of changes in cyanobacterial abundance.
This makes phycocyanin monitoring useful for:
- Detecting rising cyanobacterial activity
- Tracking short-term changes
- Comparing conditions between monitoring locations
- Identifying unusual trends
- Supporting bloom surveillance programs
- Triggering additional sampling or inspection
However, an important distinction must be made.
A phycocyanin sensor is an indicator of cyanobacterial presence or abundance. It is not automatically a direct cyanotoxin analyzer.
A high phycocyanin reading does not by itself prove that a particular toxin is present at a particular concentration.
When toxin risk must be confirmed, appropriate laboratory analysis or other validated analytical methods may still be required.
This distinction is important when designing scientifically defensible monitoring programs.
Why Trend Data Can Be More Useful Than a Single Reading
For many online environmental sensors, one isolated number tells only part of the story.
Consider three monitoring results:
- Day 1: relatively low cyanobacteria indicator
- Day 2: moderate increase
- Day 3: significant increase
- Day 4: continued upward trend
Even before a management threshold is reached, the rate and persistence of change may tell operators that water conditions deserve closer attention.
This makes trend analysis one of the major advantages of continuous monitoring.
Instead of asking only:
“Is the concentration high?”
operators can also ask:
- Is cyanobacterial activity increasing?
- How quickly is it changing?
- Is the increase occurring at multiple monitoring points?
- Does it coincide with increasing water temperature?
- Did turbidity change at the same time?
- Is dissolved oxygen showing a related daily pattern?
- Did conditions change after rainfall or inflow events?
These relationships provide much more context than a single parameter alone.
Cyanobacteria Should Rarely Be Monitored in Isolation
A cyanobacteria monitoring system becomes more useful when its data can be compared with other water quality parameters.
A typical multi-parameter monitoring strategy may include:
Phycocyanin
Provides a fluorescence-based indicator related to cyanobacterial abundance and is often the core parameter for online blue-green algae monitoring.
Chlorophyll-a
Provides a broader indicator of photosynthetic algal biomass. Comparing chlorophyll-a and phycocyanin trends may help operators understand whether changes are more strongly associated with cyanobacteria or with phytoplankton more generally.
Water Temperature
Temperature strongly influences biological activity in aquatic environments.
Tracking cyanobacteria together with temperature can provide useful context when evaluating seasonal bloom development.
Dissolved Oxygen
Photosynthesis, respiration and decomposition influence dissolved oxygen.
Continuous DO data can therefore provide additional information about changing biological conditions.
pH
Intense photosynthetic activity can influence the carbonate system and cause noticeable daily pH variations.
Monitoring pH together with algae-related parameters helps provide broader water chemistry context.
Turbidity
Turbidity changes can result from suspended sediment, algae or other particles.
It should not be treated as a direct cyanobacteria measurement, but it can help explain changes in optical water conditions.
Conductivity
Conductivity provides information about changes in dissolved ionic content and can help identify changing inflows, mixing conditions or other water-quality events.
For projects requiring several parameters at one monitoring location, a multiparameter water quality sensor can be combined with specialized algae monitoring instruments according to the application.
A Better Early-Warning Strategy: Combine Multiple Data Layers
One of the most useful ways to apply cyanobacteria monitoring is to create several levels of evidence rather than relying on one sensor threshold.
A practical monitoring architecture might look like this:
Level 1 — Continuous Observation
Monitor phycocyanin and supporting water quality parameters continuously.
↓
Level 2 — Trend Detection
Identify unusual increases, rapid changes or persistent deviations from normal seasonal conditions.
↓
Level 3 — Automated Alert
Send an alarm to operators when predefined site-specific conditions are met.
↓
Level 4 — Field Verification
Inspect the monitoring location and collect additional measurements or samples.
↓
Level 5 — Laboratory Analysis
Perform microscopy, cell counting or toxin analysis when required by the monitoring program.
↓
Level 6 — Management Response
Adjust intake operations, increase sampling frequency, issue operational alerts or implement other procedures according to the organization’s monitoring plan.
This approach treats online sensing as an early-warning tool, rather than as a replacement for every analytical method.
Where Should Cyanobacteria Monitoring Sensors Be Installed?
Sensor location can have a major influence on the usefulness of collected data.
Cyanobacteria are not necessarily distributed uniformly across a water body.
Wind, currents, temperature stratification, inflows, water depth and local hydrodynamics may cause concentrations to differ significantly between locations.
For this reason, monitoring-point selection should begin with the management objective.
Drinking-Water Reservoirs
Potential monitoring locations include:
- Raw-water intake zones
- Upstream reservoir areas
- Known bloom-prone bays
- Different reservoir depths
- Major tributary inflows
The purpose is usually to provide additional information before changing conditions affect the abstraction point.
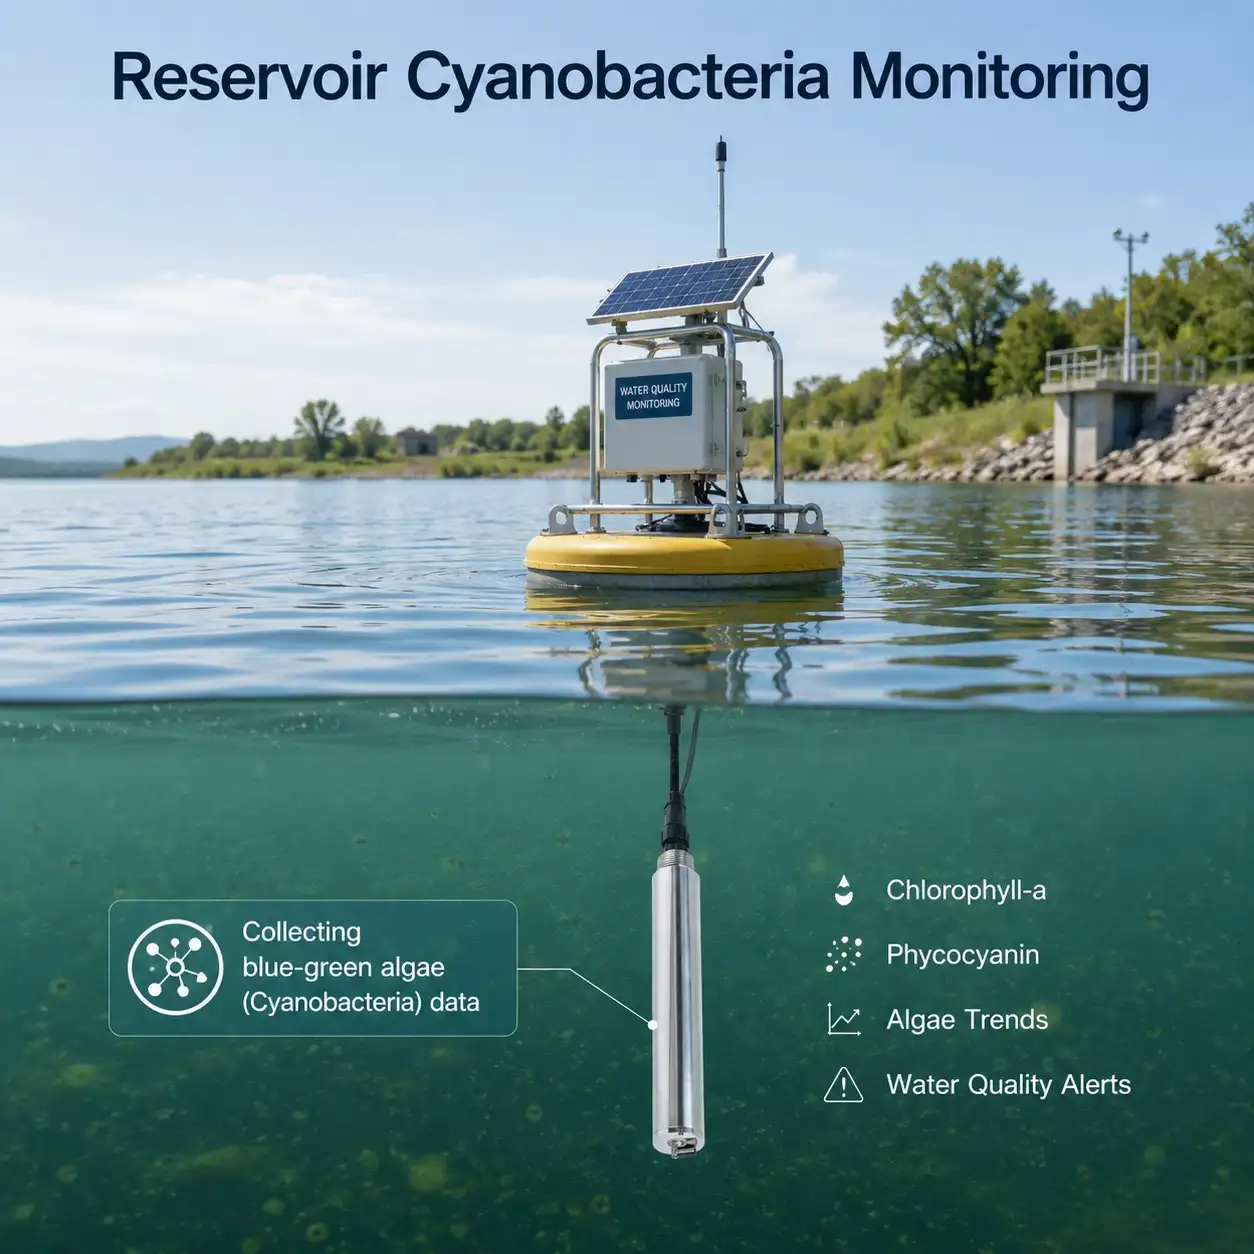
Lakes and Environmental Monitoring
Monitoring stations may be positioned:
- At historically bloom-prone locations
- Near recreational areas
- At representative open-water locations
- Near major inflows
- At sites used for routine laboratory sampling
Using the same location for continuous monitoring and periodic sampling can make comparison easier.
Aquaculture Ponds
Cyanobacteria monitoring may be combined with:
- Dissolved oxygen
- pH
- Temperature
- Turbidity
- Ammonia nitrogen
- Salinity or conductivity
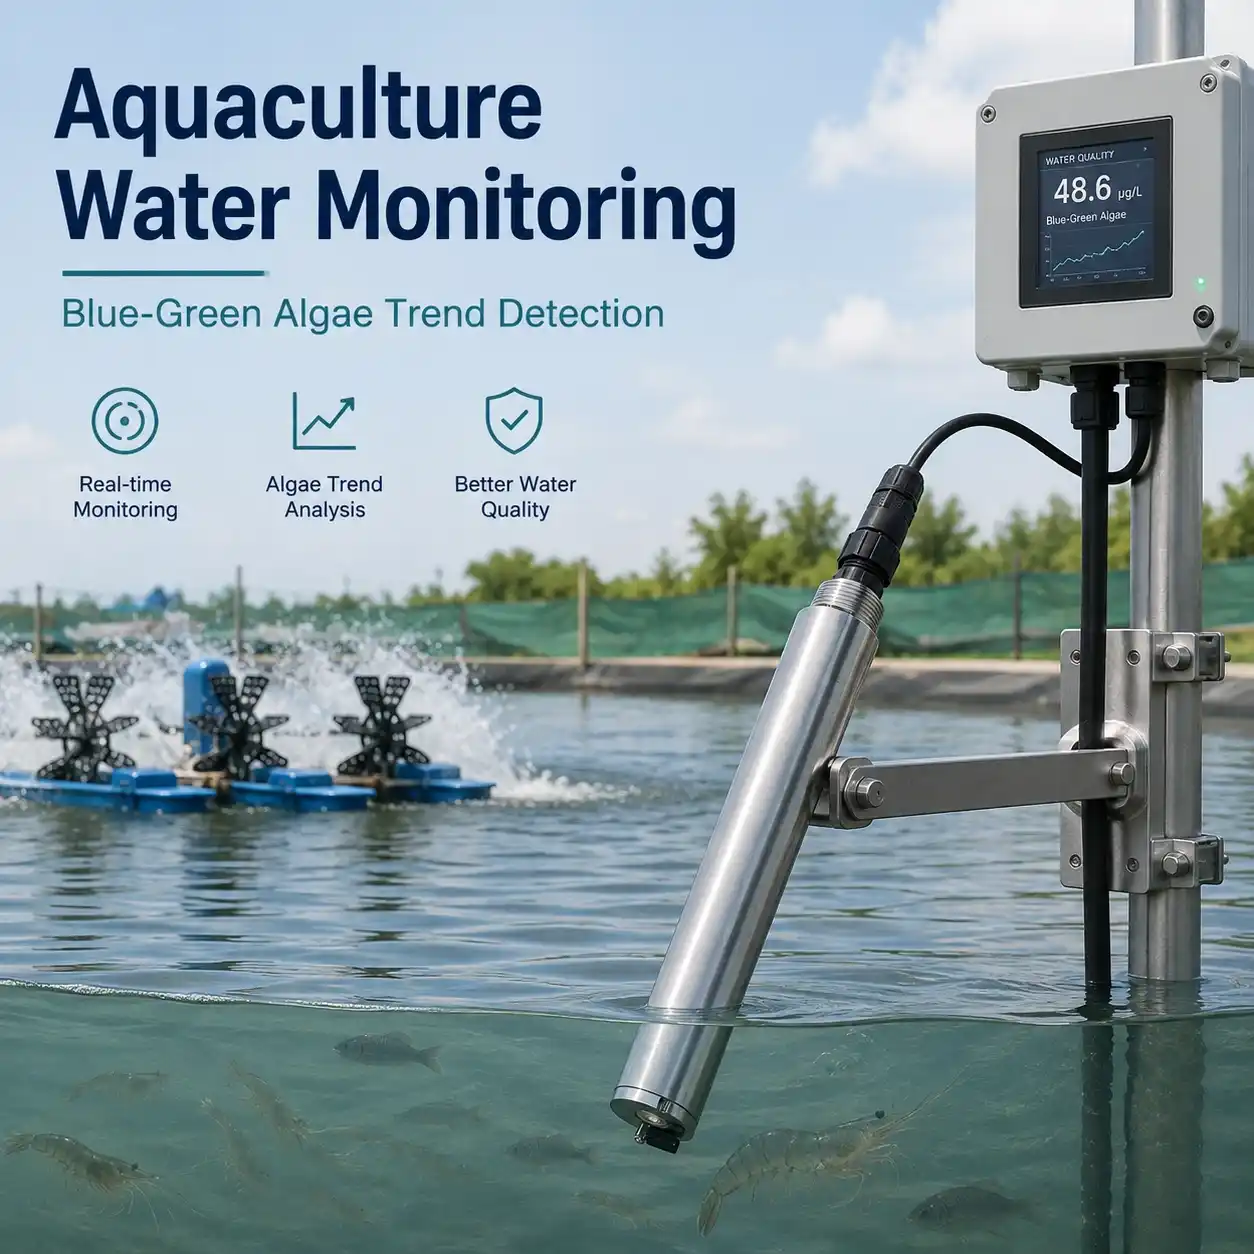
Such multi-parameter monitoring helps operators understand broader pond conditions rather than interpreting algae data separately.
Explore JW-IoT’s water quality sensor portfolio for additional parameters that can be integrated into a monitoring project.
How Real-Time Cyanobacteria Monitoring Works in an IoT System
The sensor itself is only the first part of a remote monitoring system.
A typical architecture is:
Cyanobacteria Sensor
↓
Data Logger / RTU
↓
4G / LoRaWAN / Other Communication Network
↓
Cloud Platform
↓
Dashboard + Historical Data + Alarm
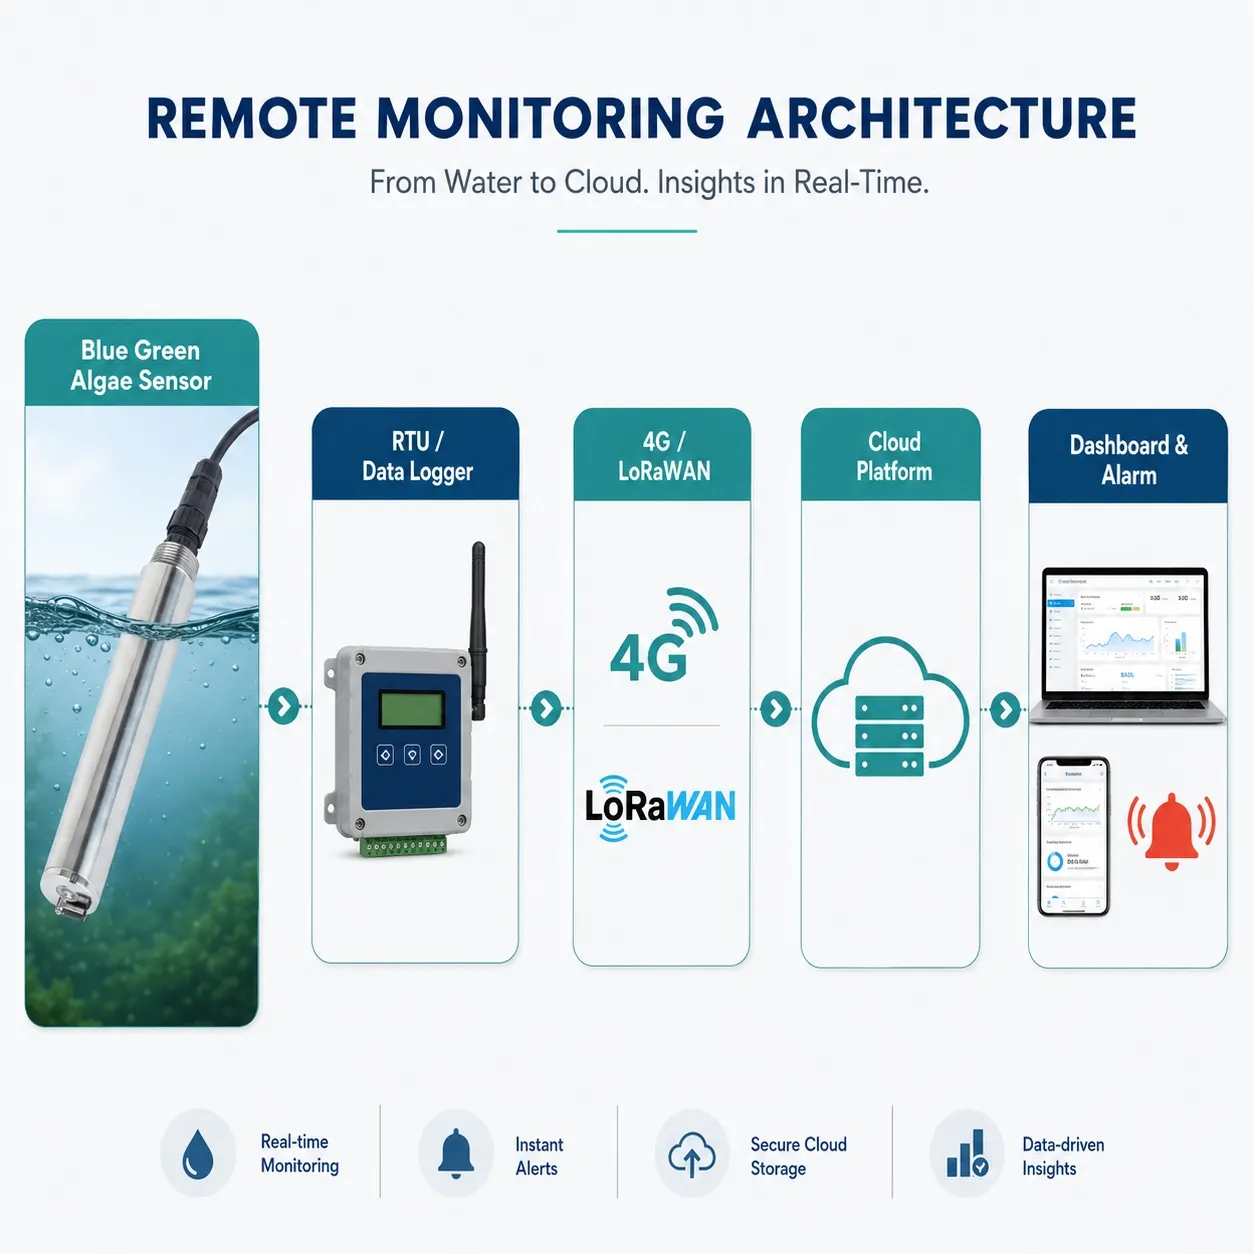
Once measurements reach the monitoring platform, users can:
- View current readings
- Analyze daily and seasonal trends
- Compare multiple monitoring locations
- Compare cyanobacteria with other parameters
- Configure threshold alarms
- Export historical data
- Connect data with external platforms through suitable interfaces
JW-IoT’s broader Smart Water & Environmental Monitoring solutions are designed around this type of sensor-to-platform architecture.
Example: Detecting a Developing Bloom in a Reservoir
Consider a reservoir with continuous monitoring near the drinking-water intake.
During normal conditions, operators establish a historical baseline for:
- Phycocyanin
- Chlorophyll-a
- Temperature
- Turbidity
- Dissolved oxygen
- pH
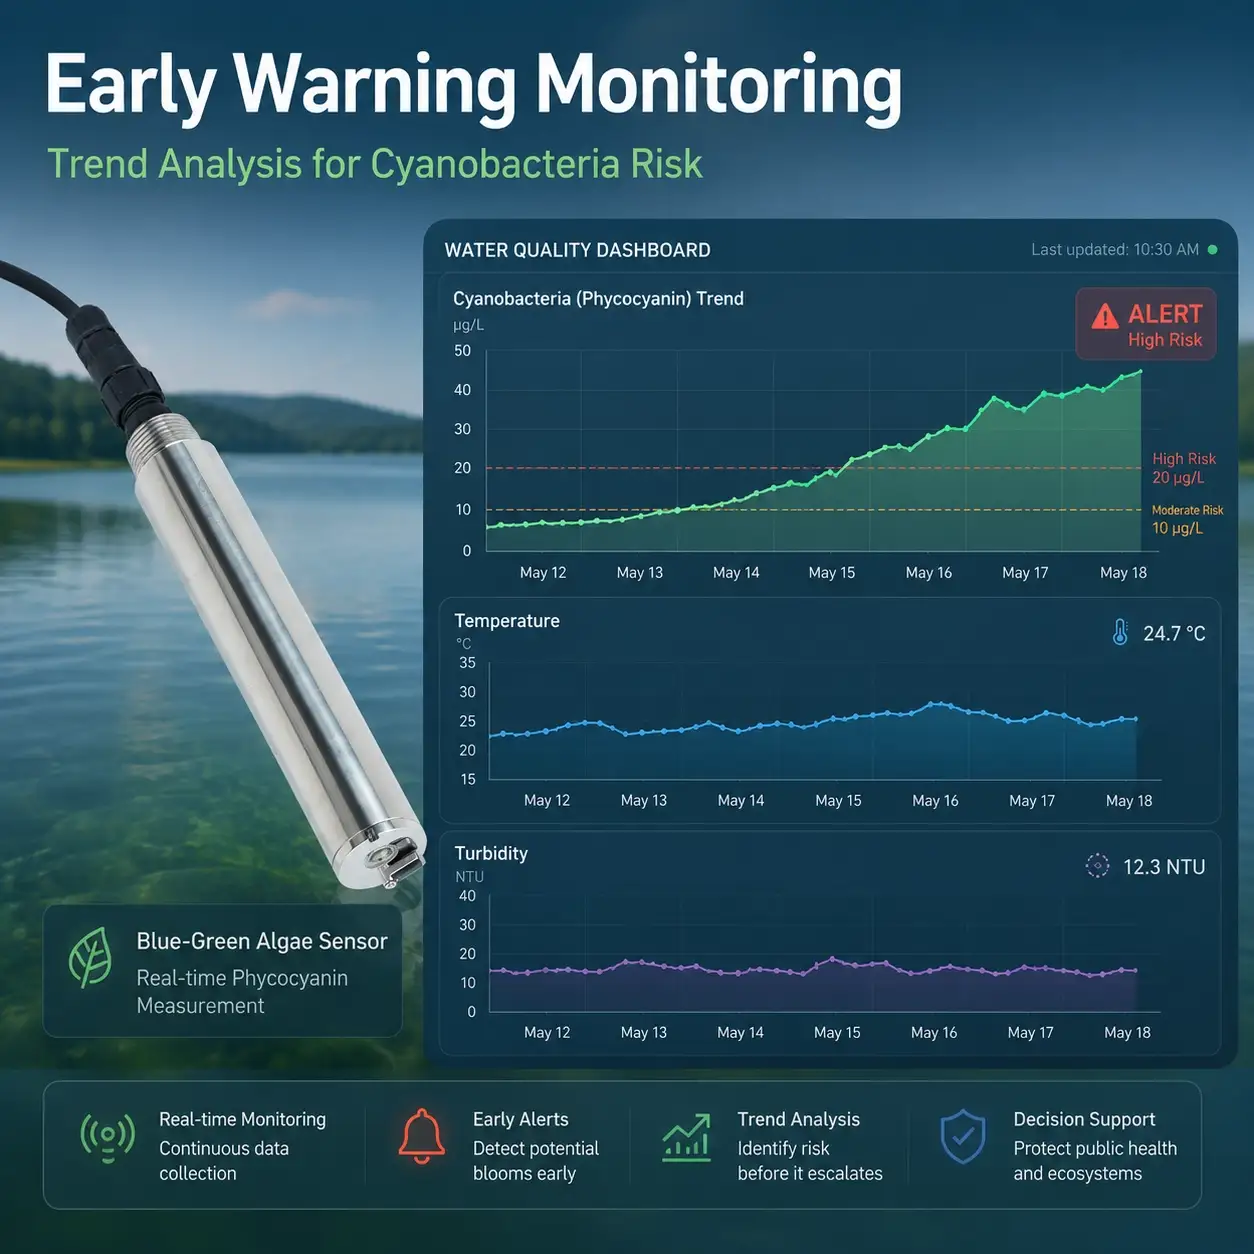
After several warm, relatively stable days, the monitoring platform begins showing a persistent increase in phycocyanin.
At the same time:
- Water temperature remains elevated
- Chlorophyll-a also increases
- Daily dissolved oxygen variation becomes larger
No single measurement necessarily confirms a harmful bloom.
However, the combination of changes gives the operator a reason to increase attention.
The monitoring team may then:
- Inspect the site.
- Collect additional water samples.
- Increase sampling frequency.
- Perform appropriate laboratory analyses.
- Continue watching real-time trends.
- Apply the organization’s response plan if required.
This illustrates the real value of online monitoring:
not replacing laboratory testing, but helping determine when and where closer investigation is needed.
Why Historical Baselines Matter
A universal alarm value is not always the best starting point for every monitoring location.
Water bodies differ substantially in:
- Natural background algae populations
- Seasonal temperature
- Nutrient conditions
- Depth
- Turbidity
- Water residence time
- Hydrodynamics
- Dominant cyanobacterial communities
A monitoring program therefore becomes more useful as historical data accumulate.
Operators can begin to establish:
- Normal seasonal ranges
- Typical day/night variations
- Background fluorescence levels
- Common responses to rainfall
- Normal temperature relationships
- Previous bloom-development patterns
Eventually, the system can move beyond simple fixed thresholds toward site-specific anomaly detection and trend-based warning rules.
Continuous Sensors and Laboratory Testing Are Complementary
One of the most common misunderstandings in algae monitoring is assuming that an online sensor and a laboratory toxin test answer the same question.
They do not.
Continuous optical monitoring is useful for:
- High-frequency observation
- Detecting change
- Tracking trends
- Remote monitoring
- Comparing locations
- Triggering alerts
Laboratory analysis is useful for:
- Species identification
- Cyanotoxin determination
- Regulatory confirmation
- Detailed quantitative analysis
The most robust monitoring programs use the appropriate method for the appropriate decision.
WHO guidance on cyanobacteria management likewise emphasizes monitoring programs as part of a broader risk-management strategy rather than relying on a single measurement technique.
How Often Should Cyanobacteria Be Measured?
There is no universal sampling interval suitable for every project.
The ideal frequency depends on:
- Waterbody dynamics
- Monitoring objective
- Sensor power consumption
- Communication bandwidth
- Bloom risk
- Required response time
- Data-storage capacity
For remote early-warning stations, measurements may be collected frequently while data are transmitted to a platform at a different interval.
For example, a data logger might record measurements locally more frequently while uploading summarized or recent readings periodically.
During suspected bloom development, monitoring or sampling frequency can also be increased.
The objective is not simply to create the largest possible dataset.
It is to collect data frequently enough to detect changes that matter operationally.
Common Mistakes in Blue-Green Algae Monitoring Projects
1. Treating Phycocyanin as a Direct Toxin Measurement
Phycocyanin provides information related to cyanobacterial abundance.
It should not automatically be interpreted as the concentration of microcystin or another cyanotoxin.
2. Monitoring Only One Parameter
Cyanobacteria data become easier to interpret when temperature, chlorophyll-a, dissolved oxygen, pH and other relevant parameters are available.
3. Selecting a Monitoring Point Only Because It Is Easy to Access
Convenient installation does not always mean representative monitoring.
The monitoring location should reflect the project’s actual management objective.
4. Ignoring Sensor Fouling
Long-term submerged optical sensors can be affected by biological growth, sediment and other contamination.
Cleaning and maintenance planning should therefore be considered when designing an unattended monitoring station.
5. Using Thresholds Without Establishing Site Context
Historical baseline data can make alarm rules substantially more meaningful.
6. Collecting Data Without Defining a Response Procedure
An alarm is useful only if the monitoring team knows what should happen afterward.
Before deployment, define:
Detection → Verification → Sampling → Analysis → Response
How to Design a Cyanobacteria Monitoring Station
A practical project-design process can start with five questions.
1. What decision should the monitoring system support?
Examples include:
- Drinking-water intake protection
- Reservoir management
- Recreational water surveillance
- Aquaculture management
- Environmental research
- Bloom early warning
2. Which parameters are necessary?
Possible combinations include:
Basic HAB Monitoring
Phycocyanin + Temperature
Enhanced Algae Monitoring
Phycocyanin + Chlorophyll-a + Temperature + Turbidity
Comprehensive Water Quality Station
Phycocyanin + Chlorophyll-a + DO + pH + Temperature + Turbidity + Conductivity
3. Where should measurements be collected?
Consider:
- Water depth
- Intake location
- Historical bloom areas
- Water movement
- Accessibility
- Cable protection
- Maintenance requirements
4. How will the data be transmitted?
Depending on site conditions, remote monitoring may use wired communication, cellular networks or low-power IoT communication.
5. What happens when abnormal conditions are detected?
Define who receives the alert and what verification procedure follows.
Choosing a Sensor for Continuous Cyanobacteria Monitoring
For continuous field monitoring, a cyanobacteria sensor should be evaluated as part of the complete monitoring system rather than only by comparing one specification.
Consider:
- Target water environment
- Expected cyanobacteria levels
- Optical measurement principle
- Measurement units
- Communication interface
- Compatibility with data loggers or RTUs
- Power requirements
- Waterproof construction
- Installation method
- Fouling risk
- Cleaning requirements
- Calibration procedure
- Integration with other water quality sensors
JW-IoT provides a dedicated Blue Green Algae Sensor for Online Water Monitoring that can be incorporated into remote water-quality monitoring architectures for lakes, reservoirs, aquaculture waters and environmental monitoring projects.
For projects requiring several water-quality parameters at the same station, the algae sensor can also be integrated with other digital water-quality sensors and remote telemetry equipment.
From Blue-Green Algae Detection to Smarter Water Management
The biggest advantage of continuous cyanobacteria monitoring is not simply that a sensor produces more measurements.
Its value comes from turning those measurements into earlier awareness of changing water conditions.
A well-designed monitoring system can help water managers move from:
occasional sampling
to
continuous observation
and from:
discovering a problem
to
detecting conditions that may require investigation.
The strongest approach combines:
Real-time sensing + multiple water quality parameters + historical trends + targeted sampling + appropriate laboratory analysis
rather than depending on any single measurement.
FAQ
1. What is cyanobacteria monitoring?
Cyanobacteria monitoring is the observation of blue-green algae and related water conditions using methods such as field inspection, laboratory analysis, microscopy, remote sensing and continuous optical sensors.
2. What does a blue-green algae sensor measure?
Many online blue-green algae sensors use fluorescence to detect phycocyanin, a pigment associated with freshwater cyanobacteria. The resulting signal can be used as an indicator of changes in cyanobacterial abundance.
3. Is phycocyanin the same as cyanotoxin?
No. Phycocyanin is a photosynthetic pigment associated with cyanobacteria. It can help indicate cyanobacterial biomass or abundance but does not directly identify or quantify every cyanotoxin.
4. Can cyanobacteria sensors provide early warning of harmful algal blooms?
Continuous cyanobacteria measurements can help identify rising or abnormal trends and can therefore support an early-warning monitoring strategy. Confirmation and management decisions may still require field inspection and laboratory analysis.
5. What other parameters should be monitored with cyanobacteria?
Useful supporting parameters may include chlorophyll-a, water temperature, dissolved oxygen, pH, turbidity and conductivity. The ideal combination depends on the application.
6. Where can blue-green algae sensors be installed?
Applications include lakes, reservoirs, source-water areas, environmental monitoring stations, aquaculture ponds and other surface-water monitoring locations.
7. Can cyanobacteria sensors be connected to an IoT platform?
Digital sensors can be integrated with compatible data loggers, RTUs, gateways and cloud platforms to support remote viewing, historical analysis and alarm functions.
8. Does a cyanobacteria sensor replace laboratory toxin testing?
No. Online sensors are valuable for continuous trend monitoring and screening. Laboratory analysis remains important when specific cyanobacteria identification or toxin concentration must be confirmed.
Build a Cyanobacteria Early-Warning Monitoring System
Planning a project for a reservoir, lake, drinking-water source, aquaculture facility or environmental monitoring network?
JW-IoT can help configure a monitoring architecture combining:
Blue-Green Algae Sensor + Water Quality Sensors + Data Logger / RTU + Wireless Communication + Cloud Monitoring
👉 Explore the Blue Green Algae Sensor for Online Water Monitoring
👉 View more Water Quality Sensors
👉 Explore Smart Water & Environmental Monitoring Solutions
Send us your monitoring parameters, application environment, number of monitoring points and communication requirements to get a recommended system configuration.