+86 13520127780
  info@jingelway.com








Solar PV Monitoring Data for Accurate Performance Ratio and Forecasting
Release time: 2026-07-08
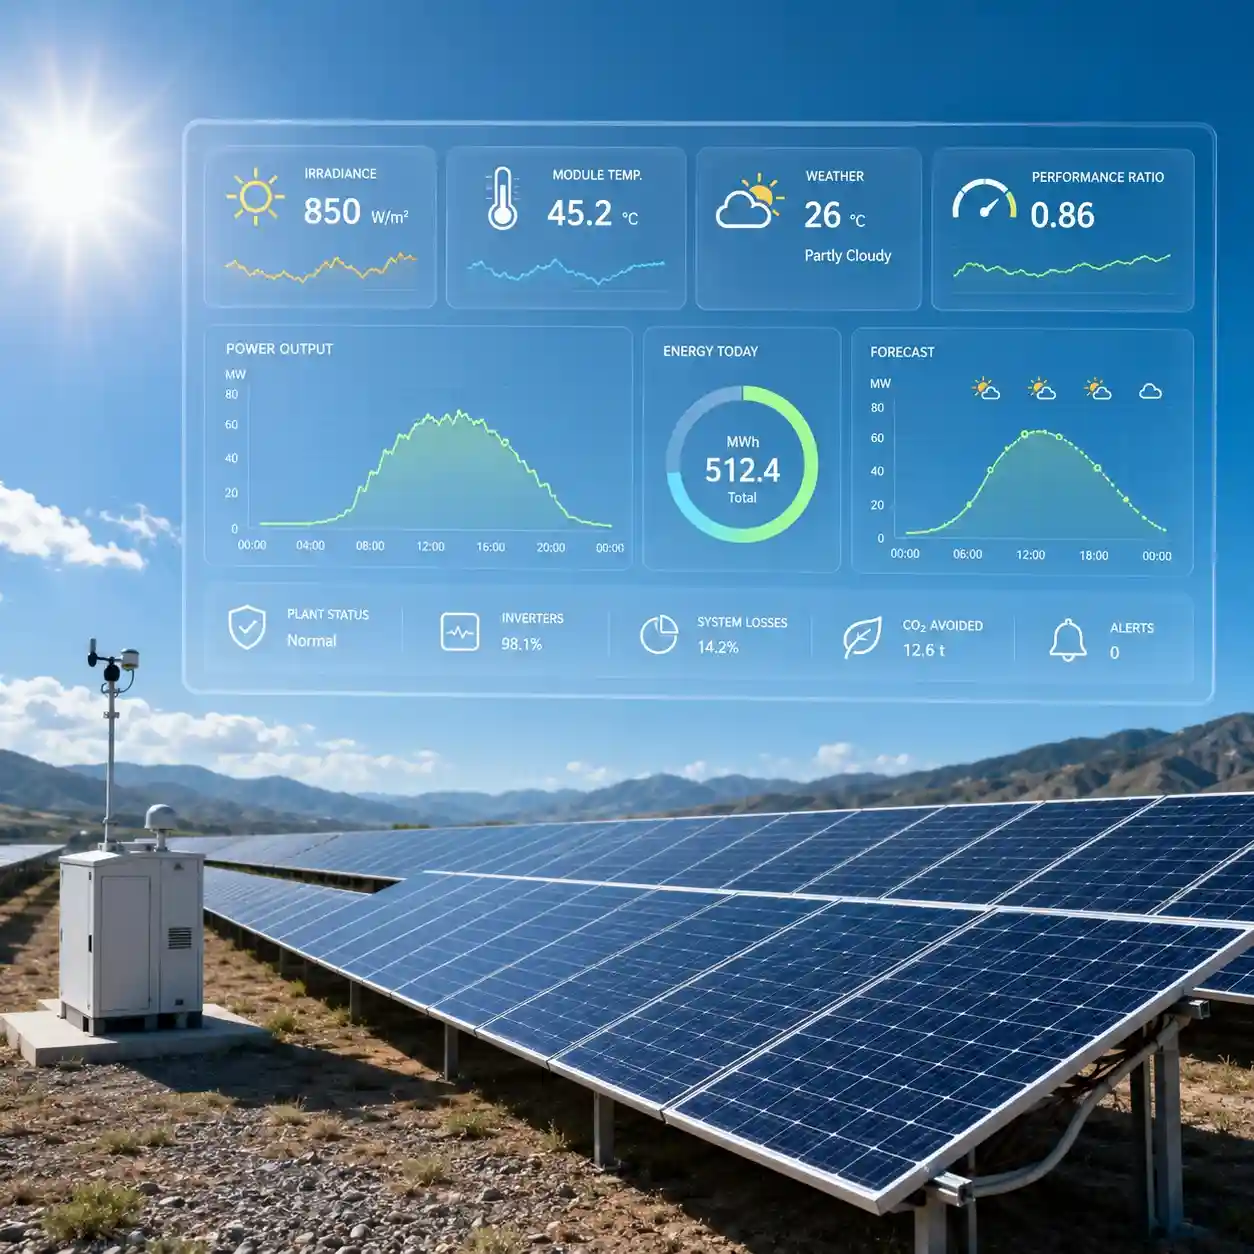
A solar power plant can generate thousands of data points every day. Yet having more data does not automatically lead to better decisions.
The real value of PV monitoring data comes from connecting environmental conditions with actual power generation. Irradiance tells us how much solar energy was available. Module temperature explains how operating conditions affected conversion efficiency. Weather data provides context for changes in production. Electrical data shows what the plant actually delivered.
When these data streams are collected at the same time and analyzed together, operators can answer the questions that matter:
- Is the plant producing as much energy as it should?
- Is a drop in output caused by clouds, high module temperature, soiling, shading, or equipment failure?
- Is the current performance ratio within the expected range?
- How much power is the plant likely to generate later today or tomorrow?
- Which losses require maintenance, and which are simply caused by weather?
This article explains what data a PV plant needs, how it supports performance ratio analysis and solar power forecasting, and how to build a reliable data collection system.
What Is PV Monitoring Data?
PV monitoring data is the combined operational, electrical, and environmental information collected from a photovoltaic power plant.
A complete monitoring dataset normally includes four groups of information:
1. Solar Resource Data
This describes the solar energy available at the project site.
Typical parameters include:
- Global horizontal irradiance, or GHI
- Plane-of-array irradiance, or POA
- Direct normal irradiance, or DNI, where required
- Diffuse horizontal irradiance, or DHI
- Reflected or rear-side irradiance for bifacial PV systems
- Daily accumulated solar radiation
For plant-level performance analysis, POA irradiance is often particularly useful because the sensor is installed at an angle that represents the orientation of the PV modules.
2. Temperature and Weather Data
These measurements describe the conditions under which the modules are operating.
They may include:
- PV module temperature
- Ambient air temperature
- Relative humidity
- Wind speed
- Wind direction
- Rainfall
- Atmospheric pressure
- Soiling or dust conditions
Temperature, wind, and irradiance are especially important because they influence module operating temperature and therefore affect expected power output.
3. Electrical Production Data
Electrical data shows what the plant actually produces.
Common measurements include:
- DC voltage and current
- DC power
- AC voltage and current
- Inverter output
- String-level output
- Daily energy yield
- Grid export
- Inverter efficiency
- Equipment operating status
4. Equipment and Event Data
Performance analysis also requires context about what was happening inside the plant.
Useful records include:
- Inverter alarms
- Communication interruptions
- Grid curtailment
- Tracker position
- Scheduled maintenance
- Cleaning events
- Equipment shutdowns
- String or combiner box faults
Without these event records, an analyst may incorrectly treat a planned outage or grid restriction as a technical performance problem.
What Data Is Needed for PV Performance Analysis?
For basic PV performance analysis, four measurements are essential:
- Solar irradiance
- PV module temperature
- Actual power or energy output
- Equipment availability
For more detailed diagnostics and forecasting, operators should also collect ambient temperature, wind speed, rainfall, humidity, soiling information, inverter status, and historical generation data.
The key is not simply collecting each parameter. The measurements must be time-synchronized.
For example, an irradiance reading recorded at 10:05 cannot be accurately compared with an inverter output recorded at 10:20 if clouds were moving across the site during that period. Even a short time mismatch can produce misleading conclusions on highly variable days.
A reliable PV monitoring system should therefore provide:
- Consistent timestamps
- A defined data sampling interval
- Sensor status monitoring
- Missing-data detection
- Historical data storage
- Data export or API access
- Calibration and maintenance records
High-quality analysis begins with high-quality field data.
Why Irradiance Data Is Essential?
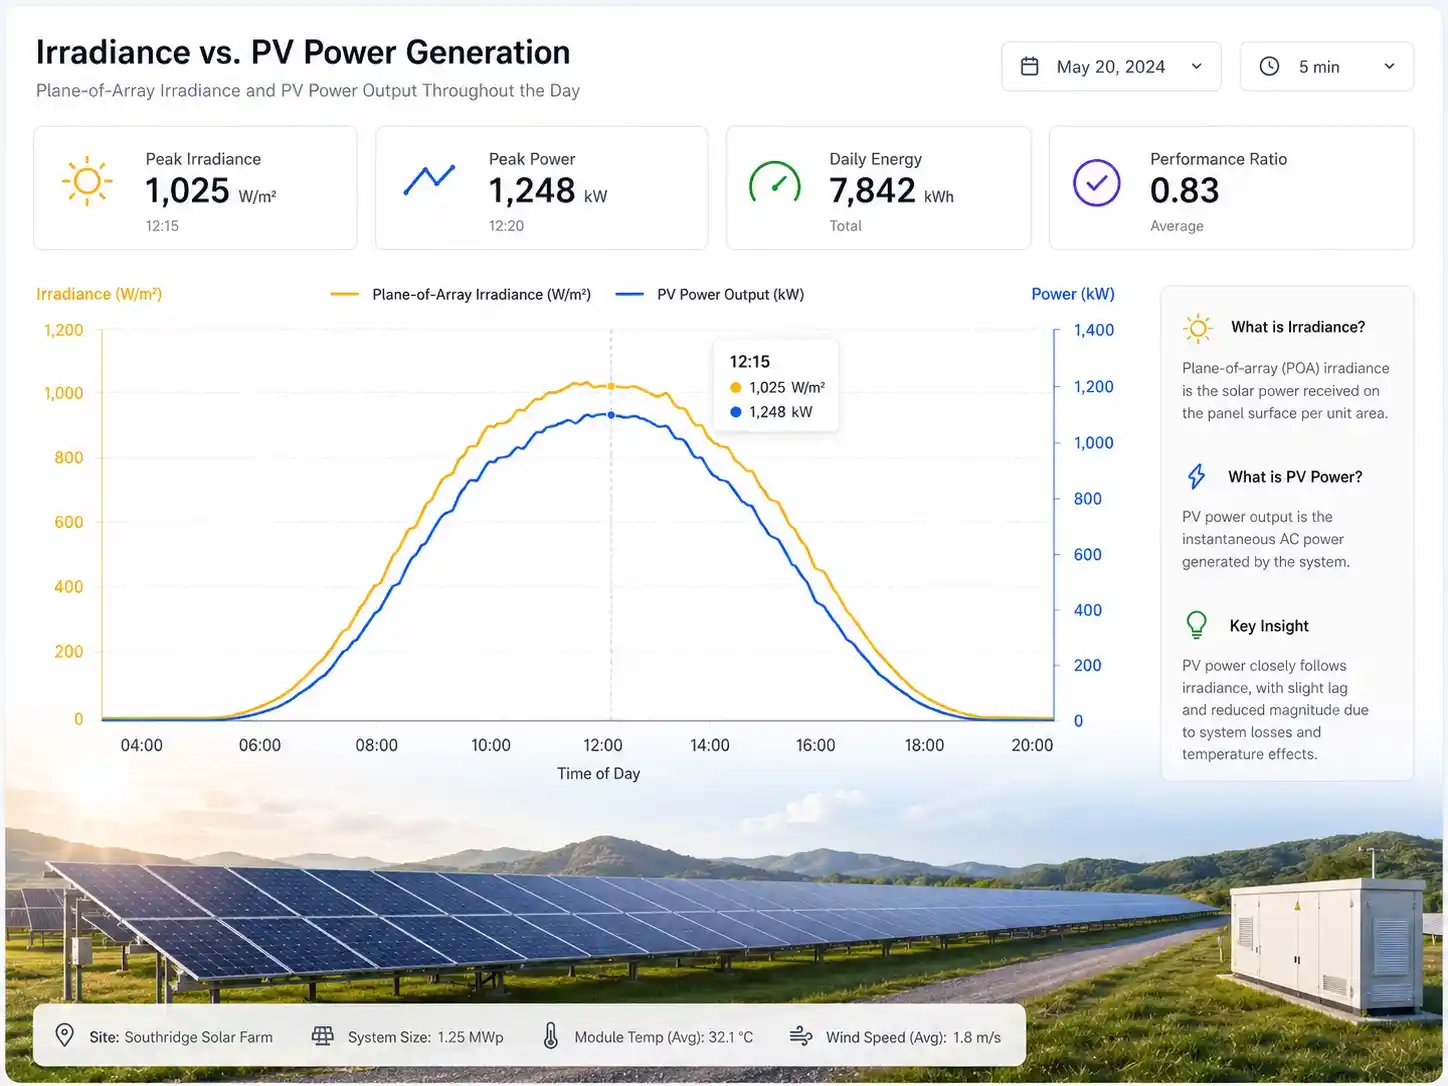
Power generation alone does not tell operators whether a PV plant is performing well.
Suppose a solar farm produces 20% less energy today than yesterday. That sounds like a problem, but the production decrease may be completely normal if today received 20% less solar irradiance.
Now consider the opposite situation. Irradiance remains almost unchanged, but energy production falls by 20%. This is much more likely to indicate an operational loss.
That loss could be related to:
- Module soiling
- Partial shading
- Inverter derating
- String disconnection
- Cable or connector problems
- Tracker misalignment
- Module degradation
- Grid curtailment
- Sensor or communication faults
Irradiance data provides the environmental reference needed to distinguish between lower solar availability and lower system efficiency.
For this reason, a properly installed solar irradiance sensor is one of the most important components of a PV monitoring system.
JW-IoT solar monitoring solutions can combine global or plane-of-array irradiance measurement with module temperature, weather sensors, data acquisition, remote communication, and cloud-based visualization.
GHI Versus POA Irradiance
GHI measures the total solar radiation received by a horizontal surface. It is useful for general solar resource assessment and weather analysis.
POA irradiance measures the solar radiation reaching the plane of the PV array. Because module tilt and orientation directly affect received solar energy, POA irradiance is usually more representative when comparing available sunlight with actual array output.
For fixed-tilt plants, the POA sensor should match the array tilt and azimuth as closely as possible.
For single-axis tracking plants, irradiance measurement requires more careful sensor positioning and maintenance because the array angle changes throughout the day. Accurate incident irradiance measurement, together with temperature and meteorological data, is fundamental to evaluating absolute PV system performance.
Irradiance Sensor Quality Matters
A small irradiance measurement error can create a larger analytical problem when the data is accumulated over weeks or months.
Common sources of error include:
- Incorrect sensor tilt
- Sensor shading
- Dust on the sensor dome or surface
- Poor leveling
- Cable or signal problems
- Sensor drift
- Inconsistent cleaning between the sensor and PV modules
- Installation in a location that does not represent the array
Operators should treat the irradiance sensor as a measurement instrument, not simply as another device attached to the weather station.
Why PV Module Temperature Matters?
Solar modules are rated under standard test conditions, but real plants rarely operate under those conditions.
On a sunny day, module temperature can rise well above ambient air temperature. As the cells become hotter, the voltage of a typical crystalline-silicon module decreases, reducing power output.
This creates a common situation: irradiance is high, but the plant produces less power than a simple irradiance-only calculation would predict.
Without module temperature data, this reduction may be mistaken for:
- Soiling
- Module degradation
- Inverter underperformance
- String mismatch
- Electrical failure
A PV module temperature sensor provides the missing context. It helps operators separate normal thermal losses from abnormal performance losses.
PV performance models commonly use irradiance, ambient temperature, and wind speed to estimate cell or module temperature and its effect on array output.
Module Temperature Versus Ambient Temperature
Ambient air temperature and module temperature are not interchangeable.
Two plants may experience the same ambient temperature but very different module temperatures because of differences in:
- Solar irradiance
- Wind speed
- Mounting height
- Rear ventilation
- Roof material
- Array spacing
- Module technology
- Water cooling effects in floating PV systems
A rooftop array installed close to a dark roof may operate hotter than a ground-mounted array with good rear ventilation. A floating PV system may benefit from a cooler local environment, although individual modules can still develop abnormal hot areas.
Direct module temperature measurement is therefore more useful than ambient temperature alone when evaluating thermal performance.
Where Should a Module Temperature Sensor Be Installed?
The sensor is normally attached to the rear surface of a representative module.
Good installation practice includes:
- Selecting a module that represents the wider array
- Avoiding module edges where temperature may differ
- Ensuring secure thermal contact
- Protecting the cable from movement and UV exposure
- Recording the exact installation position
- Using more than one sensor when the plant has different orientations or mounting conditions
Historical NREL guidance has recommended positioning a rear-module temperature sensor near the center of a representative cell area rather than at the edge of the module.
How Weather Data Supports Solar Power Forecasting?
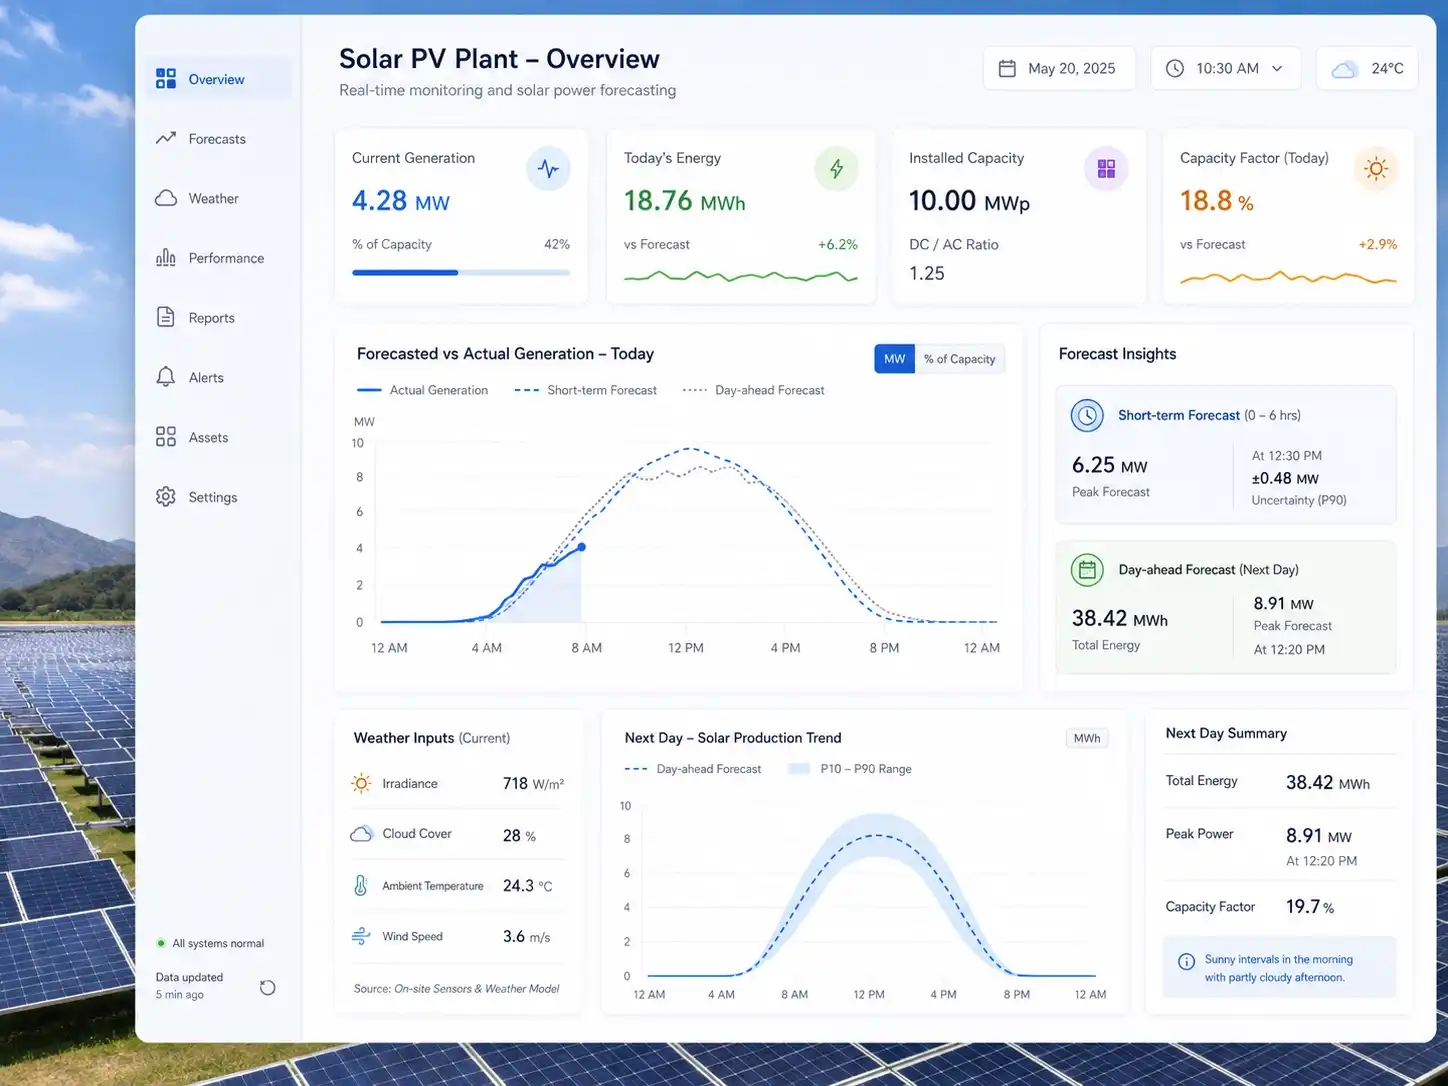
Solar power forecasting is not based on irradiance alone.
Short-term and day-ahead forecasting models may use:
- Current irradiance
- Forecast irradiance
- Cloud movement
- Ambient temperature
- Module or cell temperature
- Wind speed
- Humidity
- Historical power output
- Plant capacity
- Module orientation
- Tracker position
- Inverter characteristics
- Availability and curtailment data
Irradiance indicates the available solar resource, while temperature helps estimate how efficiently the modules are likely to convert that resource into electricity.
NREL forecasting research has used irradiance, ambient temperature, and wind speed as inputs to convert predicted weather conditions into expected AC power generation.
Different Forecast Horizons Need Different Data
Very Short-Term Forecasting
Forecasts covering the next few minutes to several hours often depend heavily on:
- Real-time irradiance
- Recent power output
- Cloud movement
- All-sky camera data
- Satellite observations
- Local weather trends
This information can help grid operators and energy managers respond to rapid ramps caused by moving clouds.
Day-Ahead Forecasting
Day-ahead models rely more heavily on:
- Numerical weather predictions
- Regional irradiance forecasts
- Temperature forecasts
- Wind forecasts
- Historical plant behavior
- Availability schedules
Local monitoring data is still important because it allows the forecasting model to learn how the specific plant behaves under different conditions.
Long-Term Yield Forecasting
Monthly and annual forecasting may include:
- Historical solar resource data
- Seasonal temperature patterns
- Module degradation
- Soiling trends
- Expected availability
- Curtailment assumptions
- Long-term weather variability
A plant with several years of clean, reliable monitoring data can usually build a much stronger performance baseline than a plant relying only on regional weather information.
Why Local Weather Data Improves Forecasting?
Regional weather services are useful, but they do not always capture the microclimate at a PV plant.
Local conditions may be affected by:
- Mountains
- Coastlines
- Reservoirs
- Urban heat
- Industrial dust
- Agricultural activity
- Uneven cloud development
- Local wind channels
A site-level PV weather station measures the conditions that the modules are actually experiencing.
This becomes especially important for distributed PV portfolios, where systems located in the same region may still experience different cloud cover, wind, temperature, and shading conditions.
What Is Performance Ratio in a Solar PV Plant?
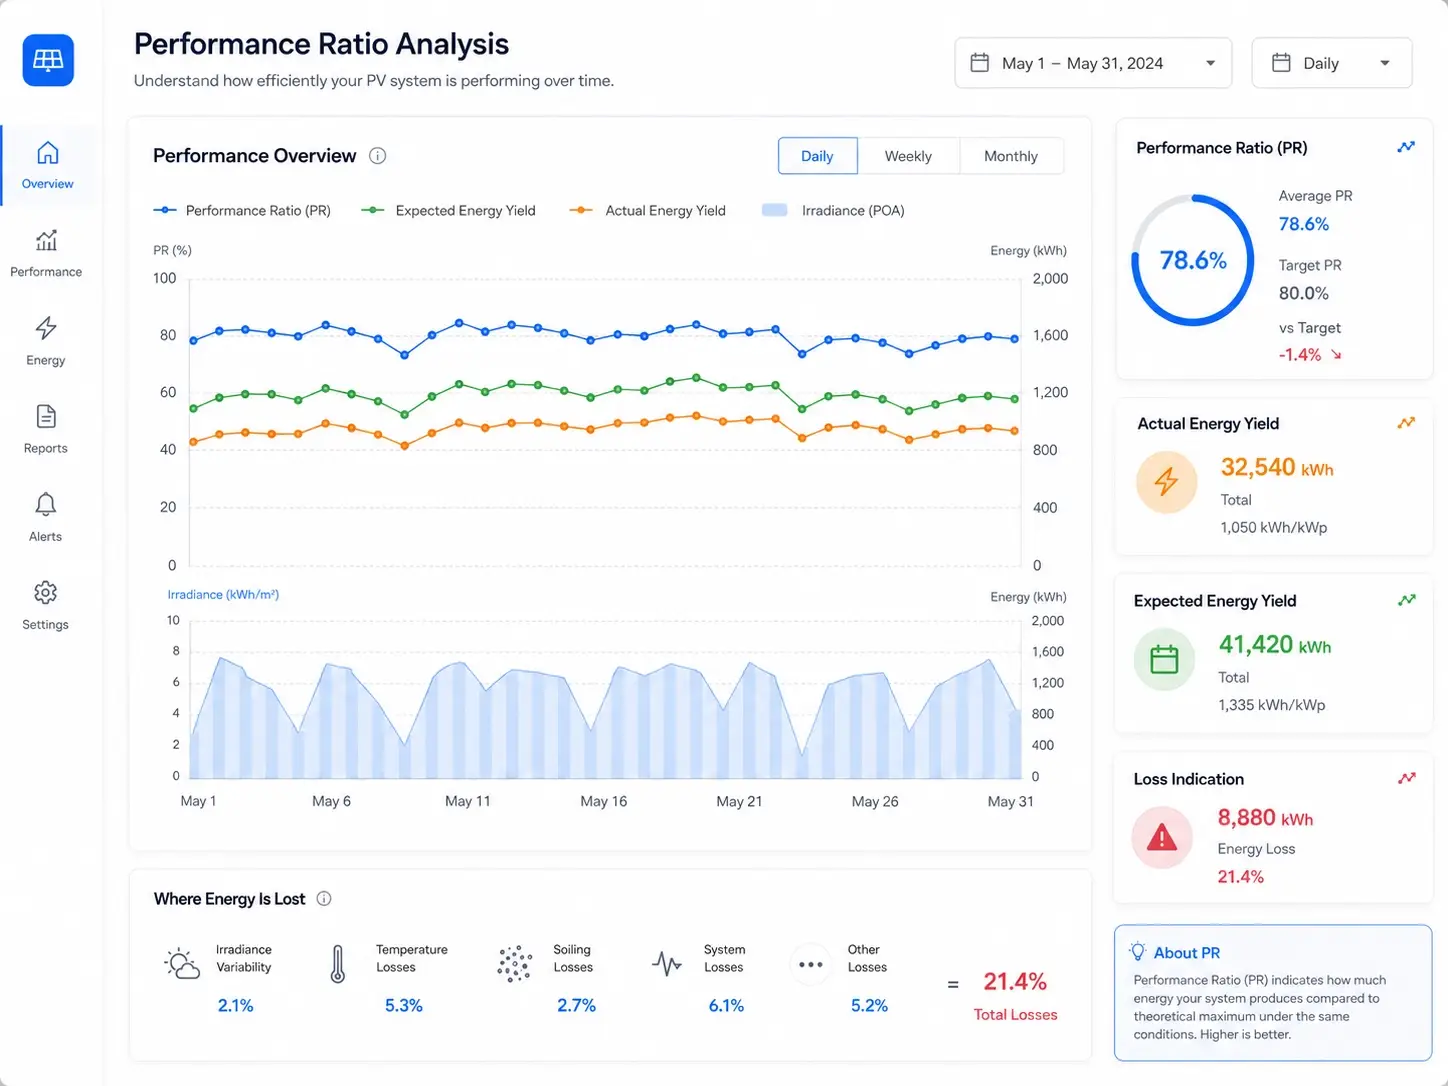
Performance ratio, usually abbreviated as PR, is a normalized indicator used to compare a PV plant’s actual energy output with the energy it could theoretically produce from the available solar irradiation.
A simplified expression is:
PR = Final Yield ÷ Reference Yield
Where:
- Final Yield is the actual energy generated divided by installed PV capacity.
- Reference Yield is the measured irradiation divided by the reference irradiance under standard test conditions.
It can also be expressed in a simplified form as:
PR = Actual Energy Output ÷ Irradiance-Based Reference Energy
PR helps remove much of the variation caused by plant size and available sunlight. This makes it useful for comparing performance over time or between different PV systems.
IEA PVPS describes PR as a key figure that compares actual output with the output of an ideal loss-free plant operating under the same irradiation reference conditions.
What Does a Lower PR Mean?
A lower performance ratio does not automatically identify a specific fault. It tells the operator that the plant converted the available solar resource into usable electricity less effectively than expected.
Possible causes include:
- High module temperature
- Soiling
- Snow cover
- Shading
- Module mismatch
- DC cable losses
- Inverter losses
- Transformer losses
- Equipment downtime
- Grid curtailment
- Sensor errors
- Data gaps
PR is therefore best used as a starting point for investigation, not as a standalone diagnosis.
How PR Analysis Helps Detect PV Losses?
The most useful PR analysis is not a single monthly number. It is the comparison of PR trends with environmental, electrical, and maintenance data.
Example 1: Irradiance Falls and Power Falls
If irradiance and power output fall at approximately the same time, the plant may be responding normally to changing weather.
No immediate fault is indicated.
Example 2: Irradiance Is Stable but Power Falls
If irradiance remains stable while power output declines, operators should check:
- Inverter status
- String current
- Grid restrictions
- Tracker position
- Equipment alarms
- Communication data
- Recent maintenance events
Example 3: PR Declines Gradually During Dry Weather
A slow PR reduction during a dry period may indicate accumulating dust or soiling.
If rainfall or panel cleaning is followed by a visible recovery, the relationship becomes stronger.
Example 4: Midday PR Is Lower on Hot Days
When midday irradiance is high and module temperature rises significantly, a reduction in temperature-corrected output may be normal.
Module temperature data helps prevent thermal losses from being misclassified as equipment faults.
Example 5: One Zone Performs Differently From the Rest
If different sections of the plant receive similar irradiance but one zone has lower normalized output, the cause may be local:
- Shading
- String failure
- Soiling concentration
- Tracker error
- Module mismatch
- Inverter derating
This is why large plants often require multiple representative monitoring points rather than one weather station for the entire site.
Common Reasons PV Monitoring Data Becomes Unreliable
A monitoring system may look complete on paper and still produce poor analytical results.
The most common problems include:
Sensor Placement Errors
An irradiance sensor installed at the wrong angle will not accurately represent the modules.
Unsynchronized Data
Sensor readings and inverter data with different timestamps cannot be compared reliably.
Missing Data
Communication failures may create gaps that distort daily energy totals and PR calculations.
Dirty Irradiance Sensors
A dirty sensor may report less irradiance than the modules actually receive, making the plant appear more efficient than it is.
Unrecorded Maintenance Events
Cleaning, inverter shutdowns, and grid restrictions should be logged so analysts can explain sudden changes.
Lack of Calibration
Sensor drift can create long-term bias that may be mistaken for module degradation or plant improvement.
Using One Sensor for a Complex Site
Large, uneven, mountainous, bifacial, or multi-orientation projects may need several monitoring points.
Good monitoring depends on engineering design, installation, maintenance, and data governance—not only on sensor specifications.
Recommended PV Monitoring Data Collection System
A practical monitoring architecture should connect field sensors, electrical equipment, data acquisition, communication, and analysis tools.
Field Monitoring Layer
Recommended devices may include:
- POA irradiance sensor
- GHI pyranometer
- Rear irradiance sensor for bifacial modules
- PV module temperature sensor
- Ambient temperature and humidity sensor
- Wind speed and direction sensor
- Rain gauge
- Soiling measurement device
- Inverter and string monitoring devices
Data Acquisition Layer
A data logger or RTU collects information from sensors and electrical equipment.
Common interfaces include:
- RS485 Modbus RTU
- SDI-12
- 4–20 mA
- Voltage signals
- Pulse inputs
- Ethernet
- Digital status inputs
The acquisition unit should also provide local storage so data is not permanently lost during a network interruption.
Communication Layer
The best communication method depends on site size and infrastructure.
Options may include:
- Ethernet for local plant networks
- Fiber for large utility plants
- 4G LTE for remote stations
- LoRaWAN for distributed low-power sensor nodes
- Wi-Fi for suitable rooftop applications
- Satellite communication for isolated sites
Platform and Integration Layer
The platform should support:
- Real-time dashboards
- Irradiance and power comparison
- Module temperature trends
- PR calculation
- Forecast-versus-actual analysis
- Alarm notifications
- Historical data export
- Multi-site management
- API integration
- SCADA or energy management system connectivity
JW-IoT’s Solar PV Monitoring Solution integrates environmental sensors, PV monitoring devices, data acquisition, communication gateways, and cloud-based management for centralized plant visibility.
How to Choose the Right Monitoring Configuration?
The monitoring design should match the project rather than follow a fixed equipment list.
Before selecting sensors, consider:
- Is the project rooftop, ground-mounted, floating, or building-integrated?
- Is the array fixed-tilt or tracking?
- Are bifacial modules used?
- How large and geographically varied is the site?
- Are there multiple module orientations?
- Is local SCADA integration required?
- What data interval is needed?
- Does the owner require PR reporting?
- Will the data support forecasting or predictive maintenance?
- What communication infrastructure is available?
- Who will maintain and calibrate the sensors?
A small commercial rooftop may need a compact irradiance and module-temperature monitoring kit.
A utility-scale plant may require several weather stations, redundant sensors, string-level electrical data, SCADA integration, and multiple communications paths.
The correct system is the one that provides enough trustworthy data to support actual operational decisions.
From Raw Measurements to Better O&M Decisions
From Raw Measurements to Better O&M Decisions
PV monitoring data is not valuable because it fills a dashboard. It is valuable because it reduces uncertainty.
When operators compare irradiance, module temperature, weather conditions, power output, and plant events, they can determine whether a production change is expected or abnormal.
That leads to better decisions about:
- Cleaning schedules
- Fault inspections
- Inverter maintenance
- Tracker adjustment
- Performance guarantees
- Energy forecasts
- Spare parts planning
- Long-term degradation analysis
- Portfolio benchmarking
But visibility is more than just having access to numbers—it’s about gaining actionable insight. Full visibility means being able to view real-time and historical data across all your systems and installations, whether you’re managing a single rooftop or an entire fleet of utility-scale plants. Centralized monitoring platforms allow you to track every site in your portfolio, compare performance across regions, and spot trends that would otherwise go unnoticed.
The strongest monitoring systems do more than report what happened. They help explain why it happened and what the operator should investigate next.
Armed with this level of detail, operators can proactively identify underperforming assets, catch soiling or shading issues early, and schedule targeted maintenance—before small problems become costly outages. Ultimately, robust PV monitoring transforms raw data into confident O&M decisions, supporting both the day-to-day running and long-term success of your solar investment.
FAQ
1. What is the most important PV monitoring data?
The essential measurements are solar irradiance, module temperature, actual power output, energy yield, and equipment availability. Ambient temperature, wind, rainfall, soiling, inverter status, and string data improve diagnostic accuracy.
2. Why is irradiance needed to calculate performance ratio?
Irradiance represents the solar energy available to the PV array. Without it, operators cannot determine whether lower generation was caused by weaker sunlight or poorer system performance.
3. Does high irradiance always produce high PV output?
Not necessarily. High irradiance usually increases power generation, but high module temperature, inverter limits, grid curtailment, soiling, shading, or equipment faults can reduce actual output.
4. Why is module temperature data important?
PV module temperature affects electrical efficiency. Measuring it helps operators distinguish normal heat-related losses from abnormal losses caused by equipment or maintenance problems.
5. Can regional weather data replace an on-site PV weather station?
Regional or satellite data can support forecasting and fill data gaps, but on-site measurements usually provide a more representative view of the conditions experienced by the modules.
6. What data is used for solar power forecasting?
Forecasting systems may use irradiance, cloud conditions, ambient temperature, wind speed, historical power output, module characteristics, inverter behavior, equipment availability, and numerical weather predictions.
7. Can PR identify the exact cause of a PV fault?
No. PR indicates that performance is above or below the expected level, but additional data is needed to identify whether the cause is temperature, soiling, shading, downtime, curtailment, or equipment failure.
8. How often should PV monitoring data be recorded?
The ideal interval depends on the application. Short intervals provide better visibility into rapid weather and power changes, while longer averages may be suitable for reporting. All connected systems should use synchronized timestamps.
9. Can JW-IoT customize a PV monitoring data solution?
Yes. JW-IoT can configure irradiance sensors, PV module temperature sensors, weather sensors, data loggers, communication gateways, cloud platforms, and third-party integration according to the project type and monitoring objectives.
Get a PV Monitoring Data Solution
Reliable performance ratio analysis and solar power forecasting begin with accurate, synchronized field data.
JW-IoT provides configurable PV monitoring systems for rooftop solar, distributed PV, utility-scale solar farms, floating PV plants, and remote renewable energy projects.
A complete solution may include:
- Solar irradiance measurement
- PV module temperature monitoring
- Local weather monitoring
- Data logging and edge storage
- RS485 Modbus integration
- LoRaWAN, 4G, or Ethernet communication
- Cloud dashboards and alarms
- SCADA and API integration
- Historical data export
- Multi-site monitoring
Contact JW-IoT to get a customized PV Monitoring Data Solution for performance ratio analysis, generation forecasting, and solar plant operation.