+86 13520127780
  info@jingelway.com




How Utility Scale Solar Farms Use PV Weather Stations to Optimize Output
Release time: 2026-09-01
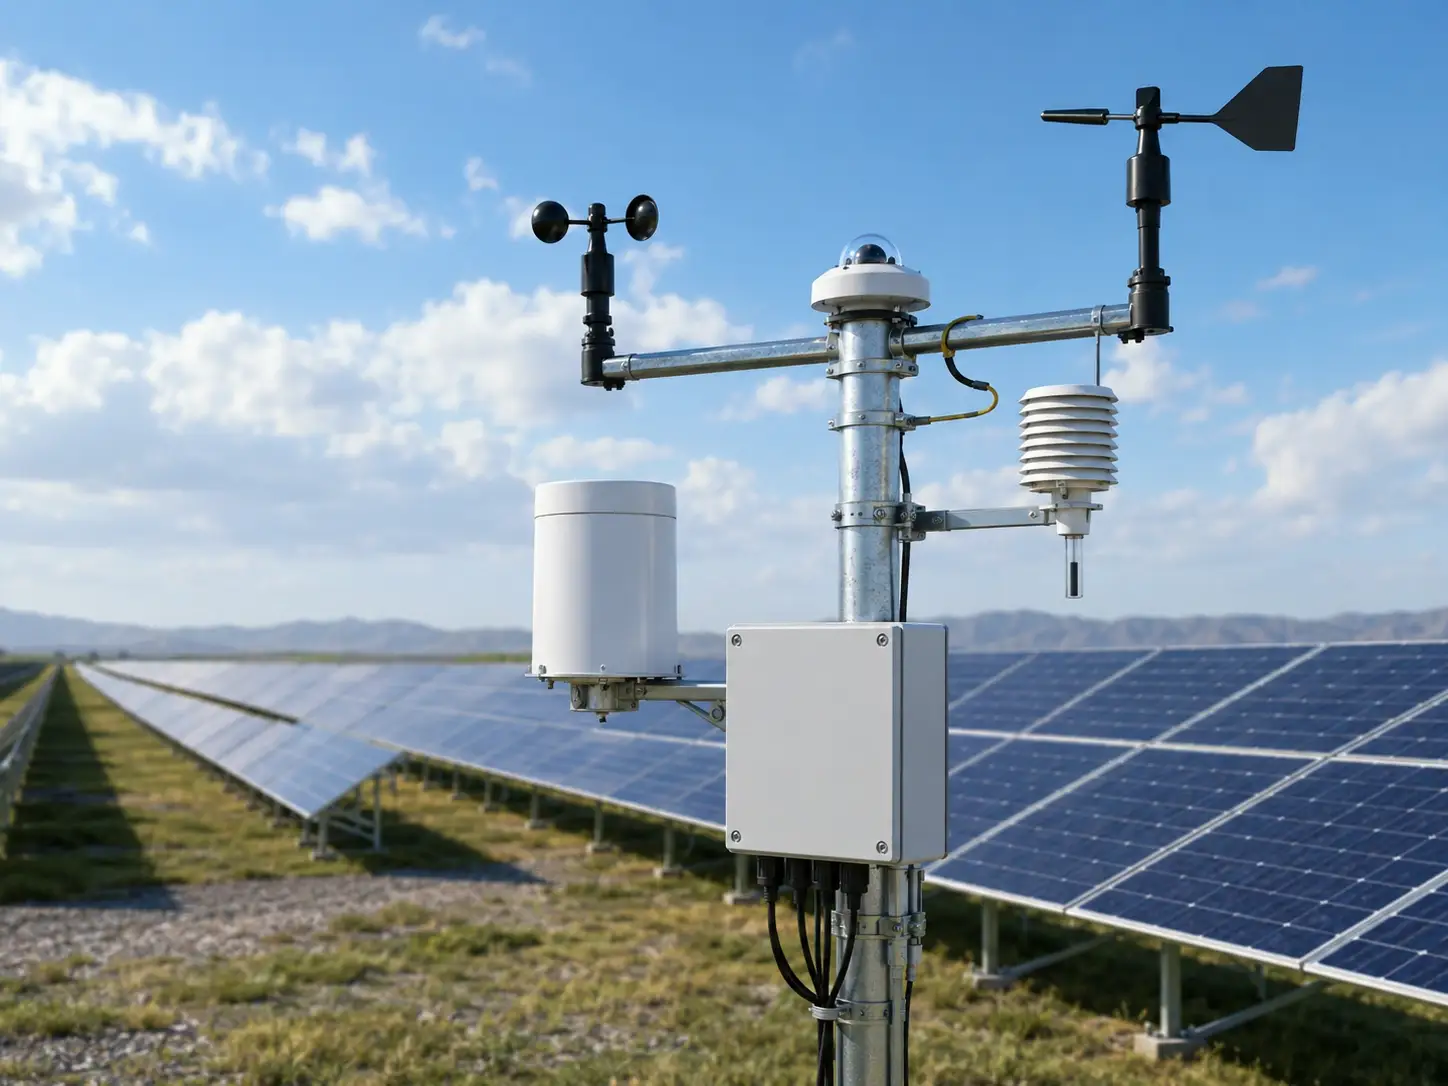
A utility scale solar farm can contain thousands—or even millions—of photovoltaic modules spread across a large area. When power generation changes unexpectedly, operators need to determine whether the cause is lower solar irradiance, high module temperature, cloud movement, dust accumulation, equipment degradation, inverter problems, or another site condition.
This is where a PV weather station becomes an important part of solar farm monitoring.
Instead of looking at electrical output alone, operators can compare generation data with actual environmental conditions at the plant. Solar irradiance, module temperature, ambient temperature, wind, rainfall, and other meteorological parameters provide the environmental context needed to understand why PV output changes.
For utility-scale projects, this data can support:
- PV performance evaluation
- Solar output optimization
- Performance ratio analysis
- Abnormal generation diagnosis
- Preventive maintenance
- Cleaning strategy optimization
- SCADA integration
- Long-term energy yield analysis
In other words, a PV weather station does more than record the weather. It helps turn environmental measurements into operational information for the solar plant.
Why Do Utility-Scale Solar Farms Need On-Site Weather Data?
Regional weather forecasts are useful for general planning, but they are not designed to explain the operating performance of a specific photovoltaic array.
Conditions inside a large solar farm can differ from those measured by the nearest public meteorological station.
Cloud cover may affect one section of the site before another. Wind conditions may vary across open terrain. Module temperatures can change considerably depending on irradiance, wind, mounting structure, and local heat conditions.
For this reason, utility-scale PV operators normally need measurements taken close to the actual arrays.
A properly configured PV plant weather station provides a reference for answering an essential operational question:
Is the solar farm producing the amount of electricity that should reasonably be expected under the current environmental conditions?
For example, imagine that a plant’s output falls by 15%.
Without environmental data, the operations team mainly knows that production has decreased.
With irradiance and temperature data, the situation becomes easier to interpret.
If irradiance has also fallen because of cloud cover, the power reduction may be expected.
If irradiance remains high while power generation drops significantly, the operator has a stronger reason to investigate equipment performance, soiling, shading, inverter availability, or other losses.
This relationship between environmental input and electrical output is one of the main reasons on-site weather monitoring is important for utility-scale PV plants.
For a complete station architecture, see the PV Plant Weather Station.
What Parameters Should a PV Weather Station Monitor?
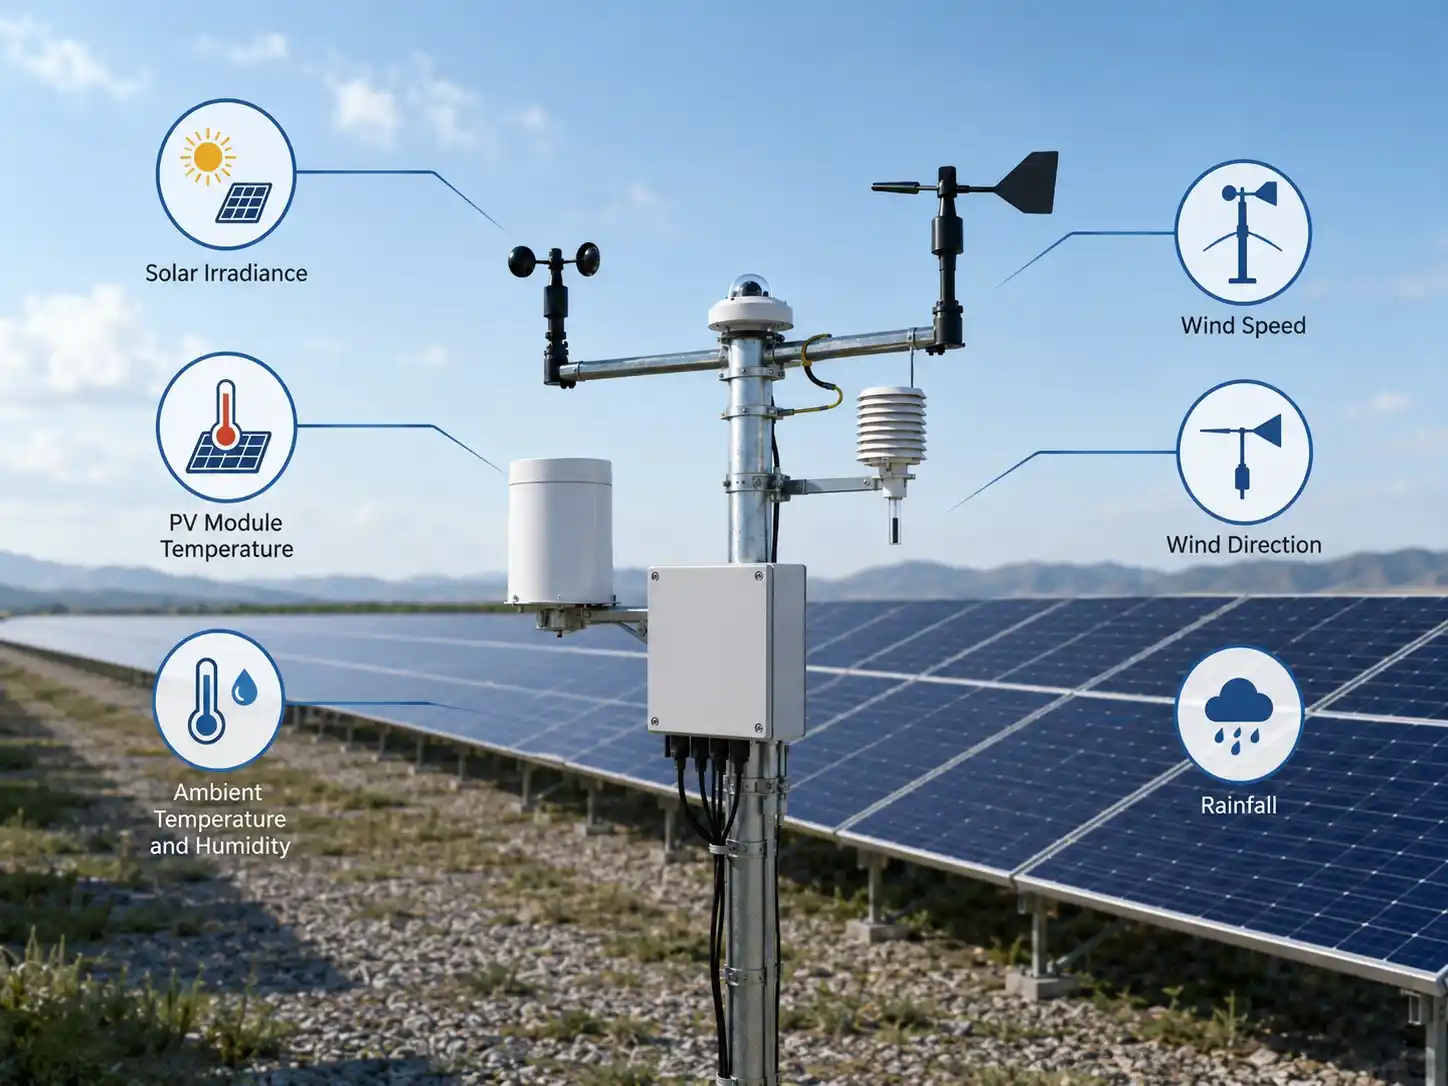
The exact configuration depends on the size, geography, technology, and operational objectives of the solar farm. However, several parameters are particularly important for PV performance analysis.
1. Solar Irradiance
Solar irradiance is usually the most important environmental input for evaluating PV generation.
Depending on the project design, measurements may include:
- Global Horizontal Irradiance (GHI)
- Plane-of-Array Irradiance (POA)
- Direct solar irradiance
- Diffuse solar irradiance
- Reflected radiation
For day-to-day plant performance analysis, POA irradiance is especially useful because the sensor can be aligned with the module plane, helping operators compare the solar energy reaching the array with the electrical energy being produced.
High-quality pyranometers or suitable solar irradiance sensors can therefore become an important reference for performance ratio and yield analysis.
2. PV Module Temperature
Solar panels generally operate at temperatures above ambient conditions when exposed to strong sunlight.
As module temperature increases, the electrical performance of PV modules can change. This means two periods with similar irradiance do not necessarily produce identical power output if module temperatures are significantly different.
Monitoring module backsheet temperature helps operators distinguish temperature-related performance changes from other causes of generation loss.
For large sites, more than one temperature monitoring point may be required to represent different arrays, orientations, or operating zones.
3. Ambient Temperature and Humidity
Ambient temperature provides environmental context for module temperature and equipment operating conditions.
Relative humidity can also be useful when studying local environmental conditions, condensation risk, corrosion exposure, or seasonal weather patterns.
These measurements become particularly valuable when combined with irradiance and module temperature rather than analyzed independently.
4. Wind Speed and Wind Direction
Wind can influence PV plants in several ways.
Airflow contributes to module cooling, meaning wind conditions can affect operating temperature.
Wind information is also useful for:
- Structural and site safety monitoring
- Tracking severe-weather events
- Understanding dust transport
- Supporting maintenance planning
- Evaluating local environmental conditions
For tracker-based PV plants or exposed desert installations, wind monitoring can also provide important operational information for plant management systems.
5. Rainfall
Rainfall does not directly indicate PV output, but it provides valuable context for maintenance and soiling analysis.
For example, rainfall records can help operators determine whether natural rain may have partially cleaned module surfaces or whether prolonged dry periods have allowed dust accumulation to increase.
Combining rainfall information with irradiance trends, soiling measurements, and power output can provide a more complete picture than evaluating any single parameter alone.
6. Optional Soiling and Advanced Radiation Measurements
Solar farms in deserts, mining regions, agricultural areas, or other dusty environments may benefit from dedicated soiling monitoring.
Depending on project requirements, an advanced PV monitoring station may also include:
- PV soiling sensors
- Reference cells
- Additional pyranometers
- Sunshine duration sensors
- Atmospheric pressure
- All-sky imaging
- Cloud monitoring
- Reflected radiation sensors
The objective is not to install every possible sensor.
The better approach is to select parameters that help explain the most important performance and maintenance risks at the specific site.
How Weather Data Helps Explain Changes in Solar Output
One of the most valuable uses of PV weather data is correlation.
Electrical production data tells the operator what the plant generated.
Environmental monitoring helps explain what resource was available for generation.
Consider four simplified scenarios.
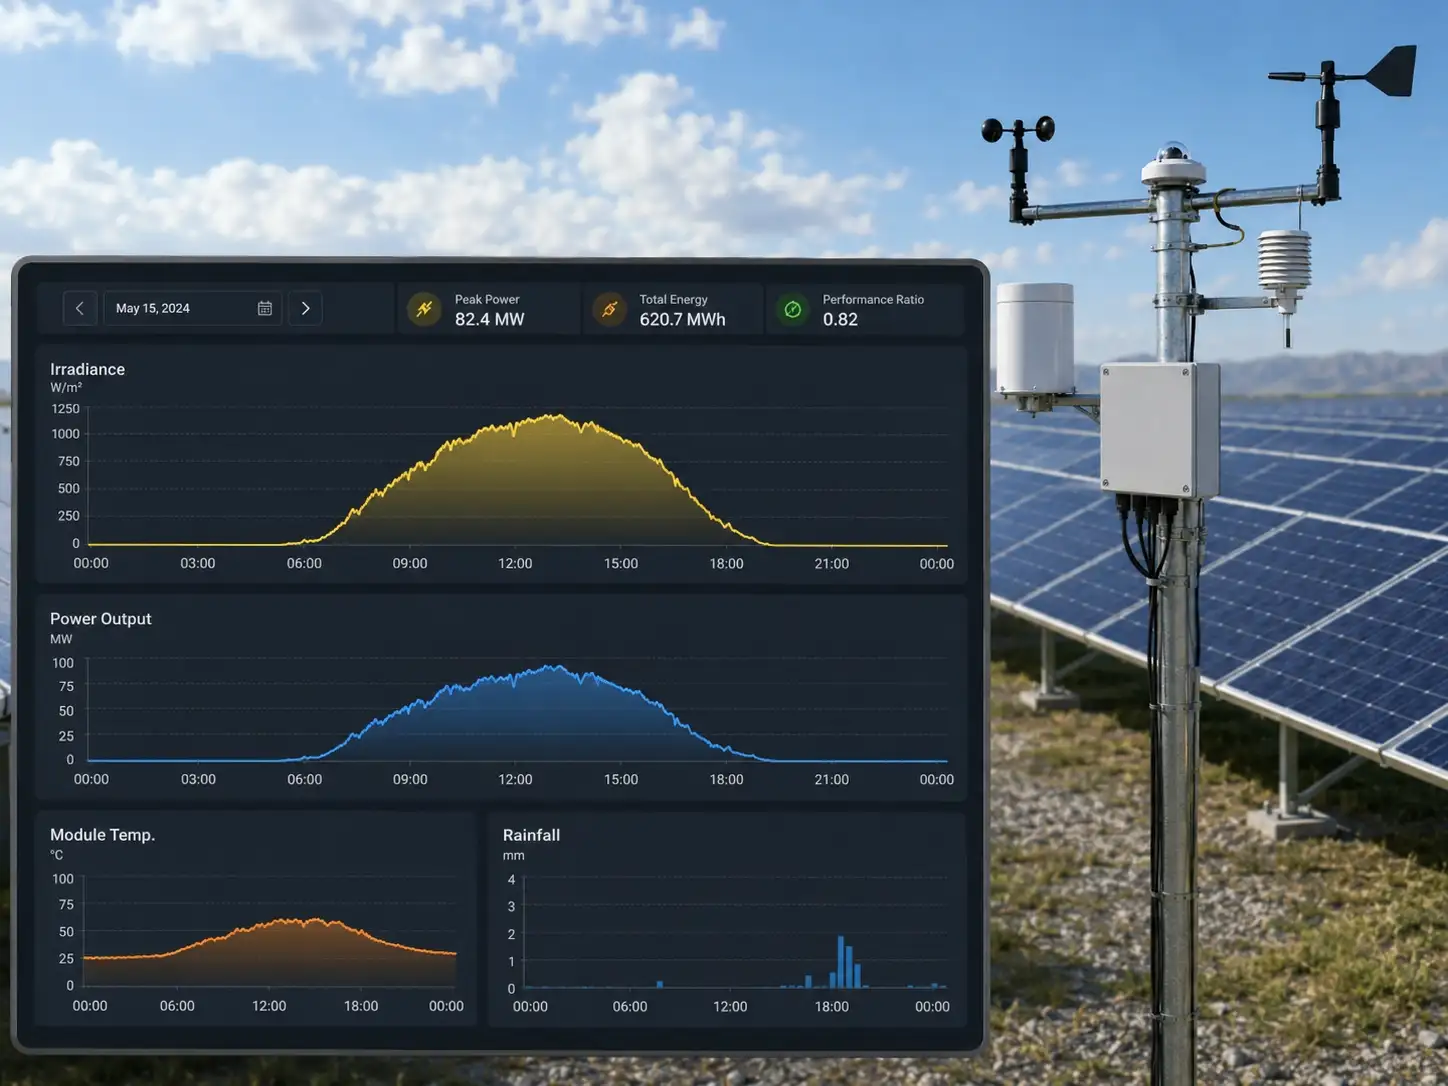
Scenario 1: Low Irradiance + Low Output
If irradiance decreases and PV generation decreases proportionally, the reduction may primarily be weather-related.
Cloud cover is an obvious example.
This avoids unnecessary equipment inspections when reduced generation is consistent with lower solar availability.
Scenario 2: High Irradiance + Unexpectedly Low Output
This situation deserves more attention.
Possible causes may include:
- Inverter faults
- String problems
- Module soiling
- Partial shading
- Curtailment
- Cable or connection problems
- Equipment degradation
- Monitoring errors
Weather data does not automatically identify the failure, but it helps remove one major uncertainty: insufficient sunlight.
Scenario 3: High Irradiance + High Module Temperature
Strong sunlight can increase both available solar energy and module temperature.
If output is lower than expected relative to irradiance, temperature data can help determine whether thermal conditions are contributing to the difference.
Scenario 4: Similar Irradiance + Different Output Between Zones
Large solar farms often contain multiple blocks or inverter zones.
If two areas receive similar irradiance but one consistently generates less power, operators can focus inspections on the lower-performing zone.
This type of comparison is particularly valuable in large facilities where manual inspection of every module or string would be inefficient.
From Weather Monitoring to PV Performance Analysis
A well-designed solar monitoring system combines several data streams:
Solar Resource Data + Environmental Data + PV Electrical Data = Better Performance Diagnosis
The weather station provides the environmental reference.
Inverters, meters, string monitoring devices, or plant controllers provide electrical operating data.
When both data sets are synchronized, the monitoring platform can compare:
- Irradiance vs. power output
- Module temperature vs. conversion performance
- Expected generation vs. actual generation
- Weather events vs. production changes
- Performance between PV zones
- Current conditions vs. historical baselines
This makes weather measurements useful not only for meteorological reporting but also for operational decision-making.
Learn more about the wider monitoring architecture in the Utility Scale Solar Monitoring System.
How PV Weather Stations Support Preventive Maintenance
Preventive maintenance becomes more effective when maintenance teams know where to investigate and why.
Detecting Abnormal Performance Earlier
Suppose irradiance remains normal but one section of the plant begins producing less energy than similar sections.
A monitoring system can flag the difference before the loss becomes large enough to be obvious through monthly production reports.
Operators can then inspect the affected area for problems such as soiling, shading, damaged modules, inverter issues, or electrical faults.
Improving Module Cleaning Decisions
Cleaning every module according to a fixed calendar can create unnecessary O&M costs, especially in very large installations.
On the other hand, delaying cleaning too long can reduce generation.
Weather and soiling data can support a more evidence-based cleaning strategy.
Operators may consider:
- Duration since the last rainfall
- Irradiance availability
- Soiling trends
- Power loss trends
- Seasonal dust conditions
- Water availability
- Cleaning cost
The result is not simply “clean more frequently,” but rather clean when the expected recovery in production justifies the maintenance effort.
Supporting Severe Weather Inspection
Wind and rainfall records can also help maintenance teams identify periods when additional field inspection may be appropriate.
After significant weather events, operators can use historical environmental records alongside alarms and electrical data to prioritize inspections.
Why One Weather Station May Not Be Enough for a Large Solar Farm
This is an important design question for utility-scale projects.
Large PV plants can cover hundreds of hectares, and environmental conditions are not always uniform across the entire site.
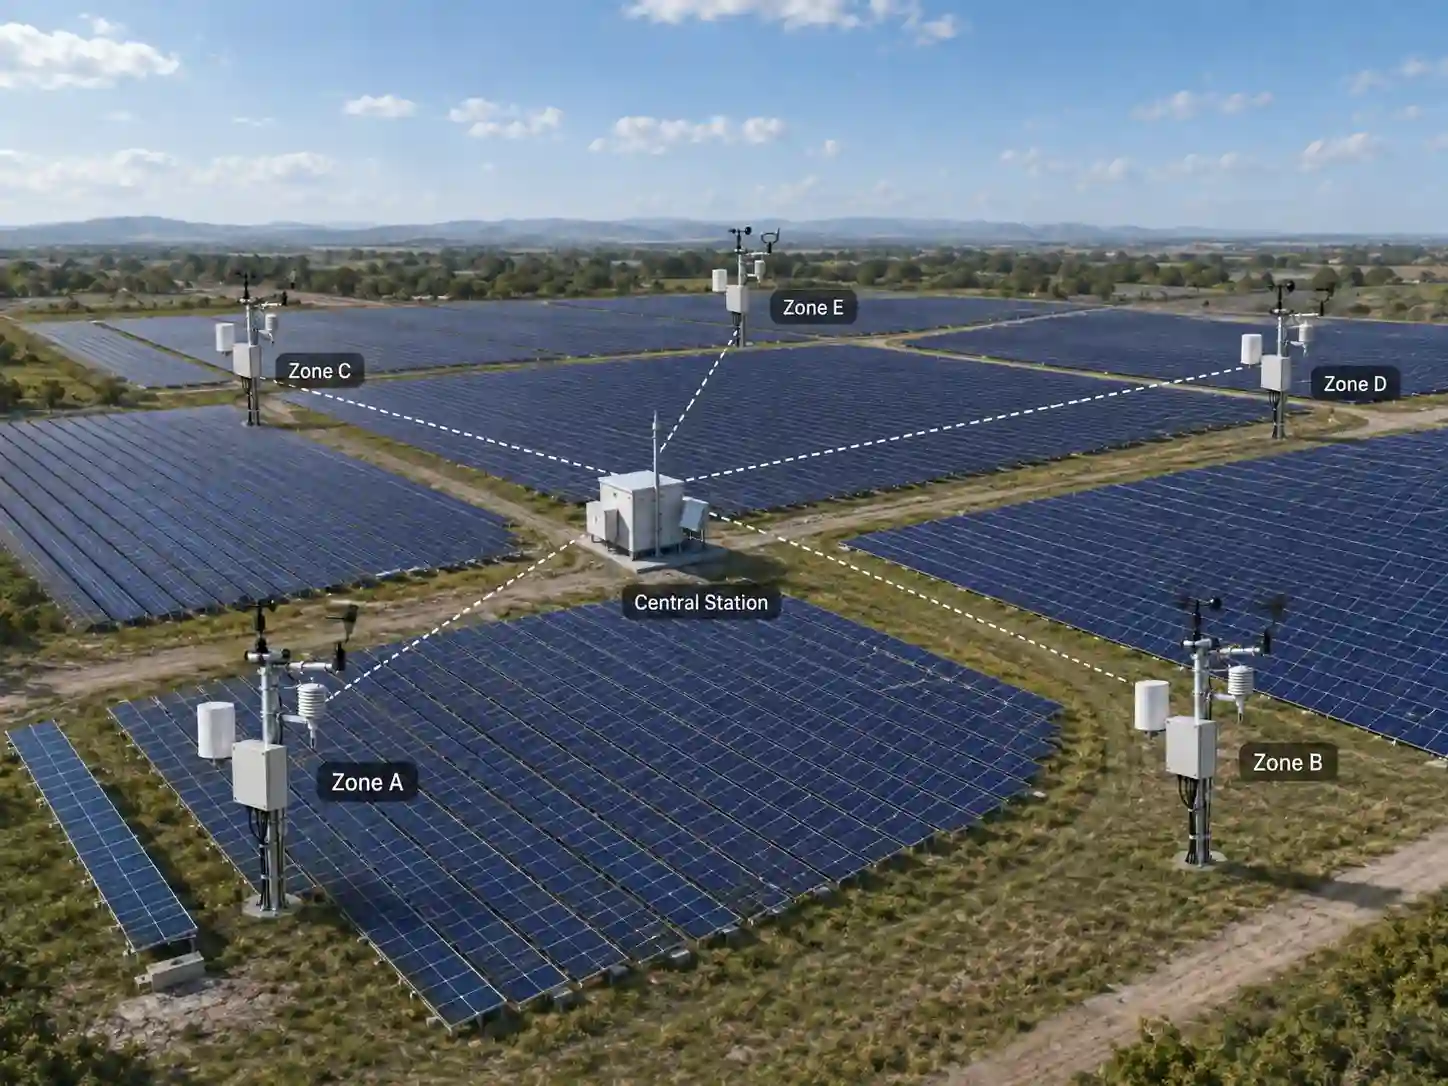
Differences may result from:
- Terrain
- Elevation
- Array orientation
- Cloud movement
- Dust distribution
- Nearby vegetation
- Local wind patterns
- Drainage conditions
For this reason, large solar farms may require distributed monitoring points rather than relying on a single station.
A typical architecture might include:
Central PV Weather Station
↓
Additional Irradiance / Module Temperature Monitoring Points
↓
Field Data Loggers or IoT Nodes
↓
RS485 / LoRaWAN / Ethernet / 4G Communication
↓
SCADA or PV O&M Platform
The number and location of monitoring points should be determined by plant size, terrain, block arrangement, accuracy requirements, communication infrastructure, and the operator’s performance monitoring objectives.
Where Should PV Weather Stations Be Installed?
Correct placement is just as important as sensor selection.
The station should represent the environmental conditions experienced by the PV arrays while avoiding interference from nearby structures.
Typical considerations include:
Irradiance Sensors
Avoid shadows from poles, buildings, antennas, cables, and nearby modules whenever possible.
POA sensors should be installed at the appropriate array tilt and orientation.
Wind Sensors
Wind sensors should have sufficient exposure to airflow and should not be heavily obstructed by structures or nearby equipment.
Module Temperature Sensors
Temperature sensors should be installed according to the measurement design and positioned so that monitored modules are representative of the array.
Multiple Monitoring Zones
For geographically large or topographically complex solar plants, several strategically distributed measurement points may provide more representative data than a single centralized station.
The objective should always be representative measurement, not simply convenient installation.
How to Integrate a PV Weather Station With SCADA
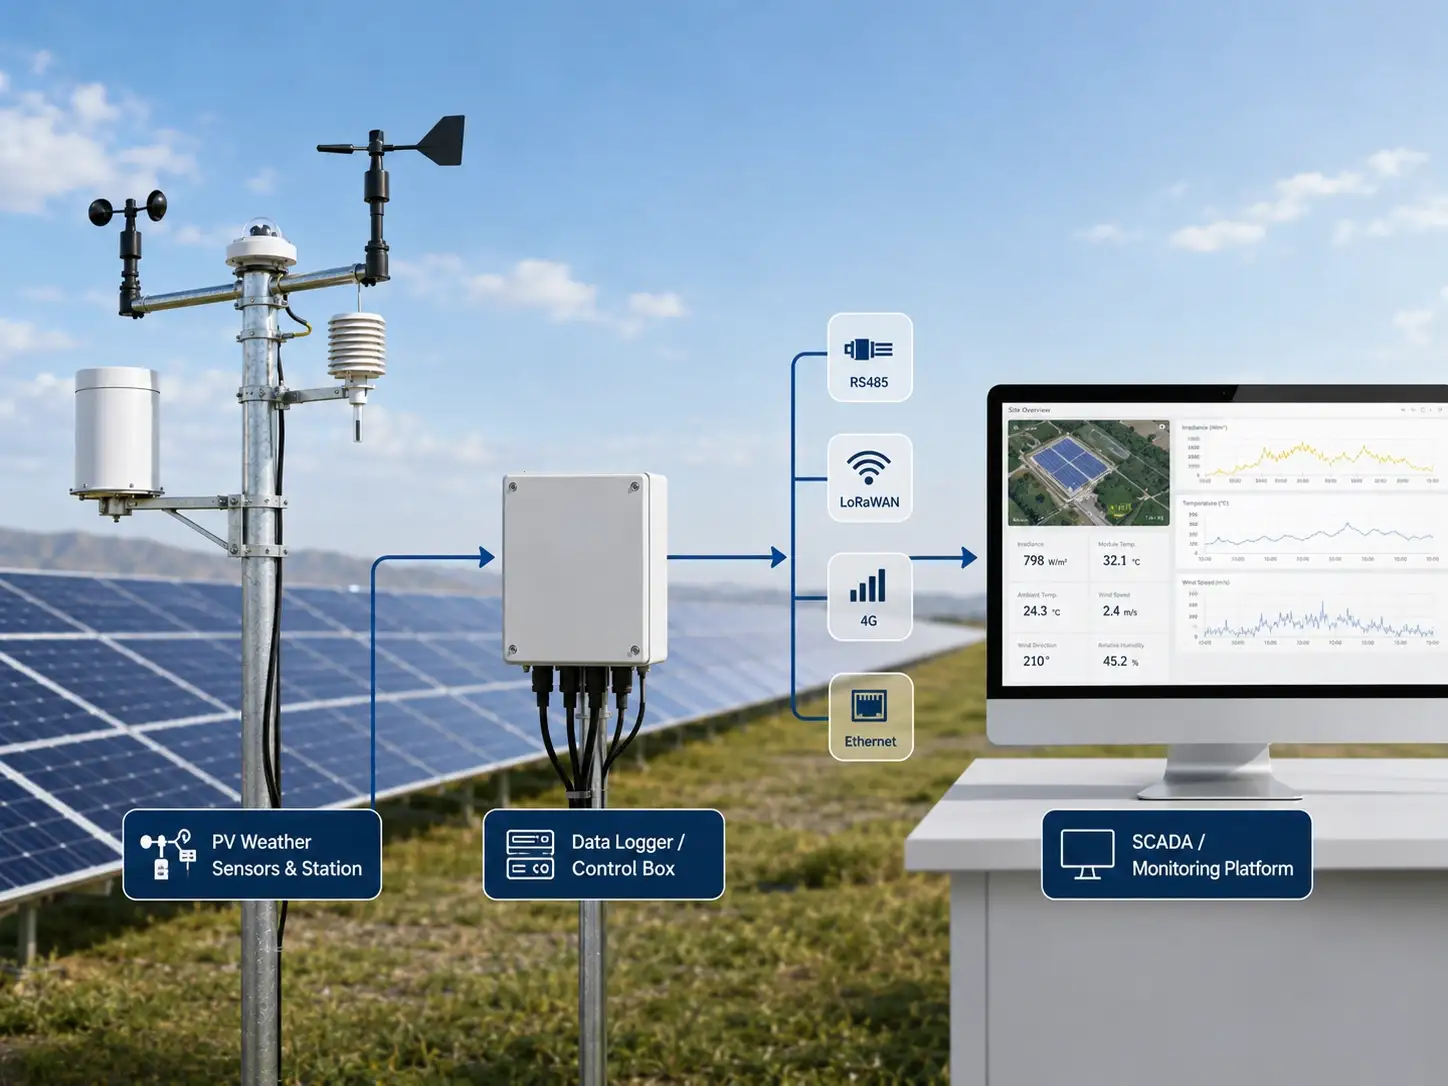
For a utility-scale solar plant, weather data becomes most useful when it enters the same operational environment as inverter, meter, alarm, and plant performance data.
A typical system can be represented as:
PV Weather Sensors
↓
Data Logger / IoT Controller
↓
Plant Communication Network
↓
SCADA / Energy Management System / Cloud Platform
The field data acquisition layer may collect information from:
- Pyranometers
- Irradiance sensors
- Module temperature sensors
- Ambient temperature and humidity sensors
- Wind sensors
- Rain gauges
- Soiling sensors
Depending on the project, communication may use technologies such as:
- RS485 / Modbus
- Ethernet
- 4G LTE
- LoRaWAN
- MQTT
- HTTP
- API-based integration
For an existing utility-scale plant, communication compatibility should be considered before purchasing individual sensors.
It is often easier to design the complete data path first:
What needs to be measured → where the sensors will be installed → how data will be acquired → how data will be transmitted → which SCADA tags or platform fields are required.
This prevents a common integration problem: purchasing sensors that measure the correct parameter but cannot easily communicate with the plant’s existing infrastructure.
A suitable PV Weather Station Data Logger and communication architecture can therefore be as important as the sensors themselves.
Centralized vs. Distributed Data Acquisition
Utility-scale solar plants generally require a different monitoring architecture from small rooftop systems.
A centralized architecture may be sufficient when sensors are located close together and field wiring is practical.
Distributed architecture becomes more attractive when monitoring points are separated by long distances.
For example:
Monitoring Point A
Irradiance + Module Temperature
↓
LoRaWAN Node
Monitoring Point B
Irradiance + Weather Sensors
↓
LoRaWAN Node
Monitoring Point C
Soiling + Module Temperature
↓
LoRaWAN Node
Multiple Field Nodes
↓
LoRaWAN Gateway / Plant Network
↓
SCADA / Cloud Platform
Wireless nodes can reduce long field cable runs, although network design, coverage, power supply, data interval, and cybersecurity requirements still need to be evaluated for each project.
Where reliable plant Ethernet or RS485 infrastructure already exists, wired integration may remain the better option.
There is no universal communication technology for every PV plant.
The right architecture depends on the site.
Recommended PV Weather Station Design for Utility-Scale Solar Farms
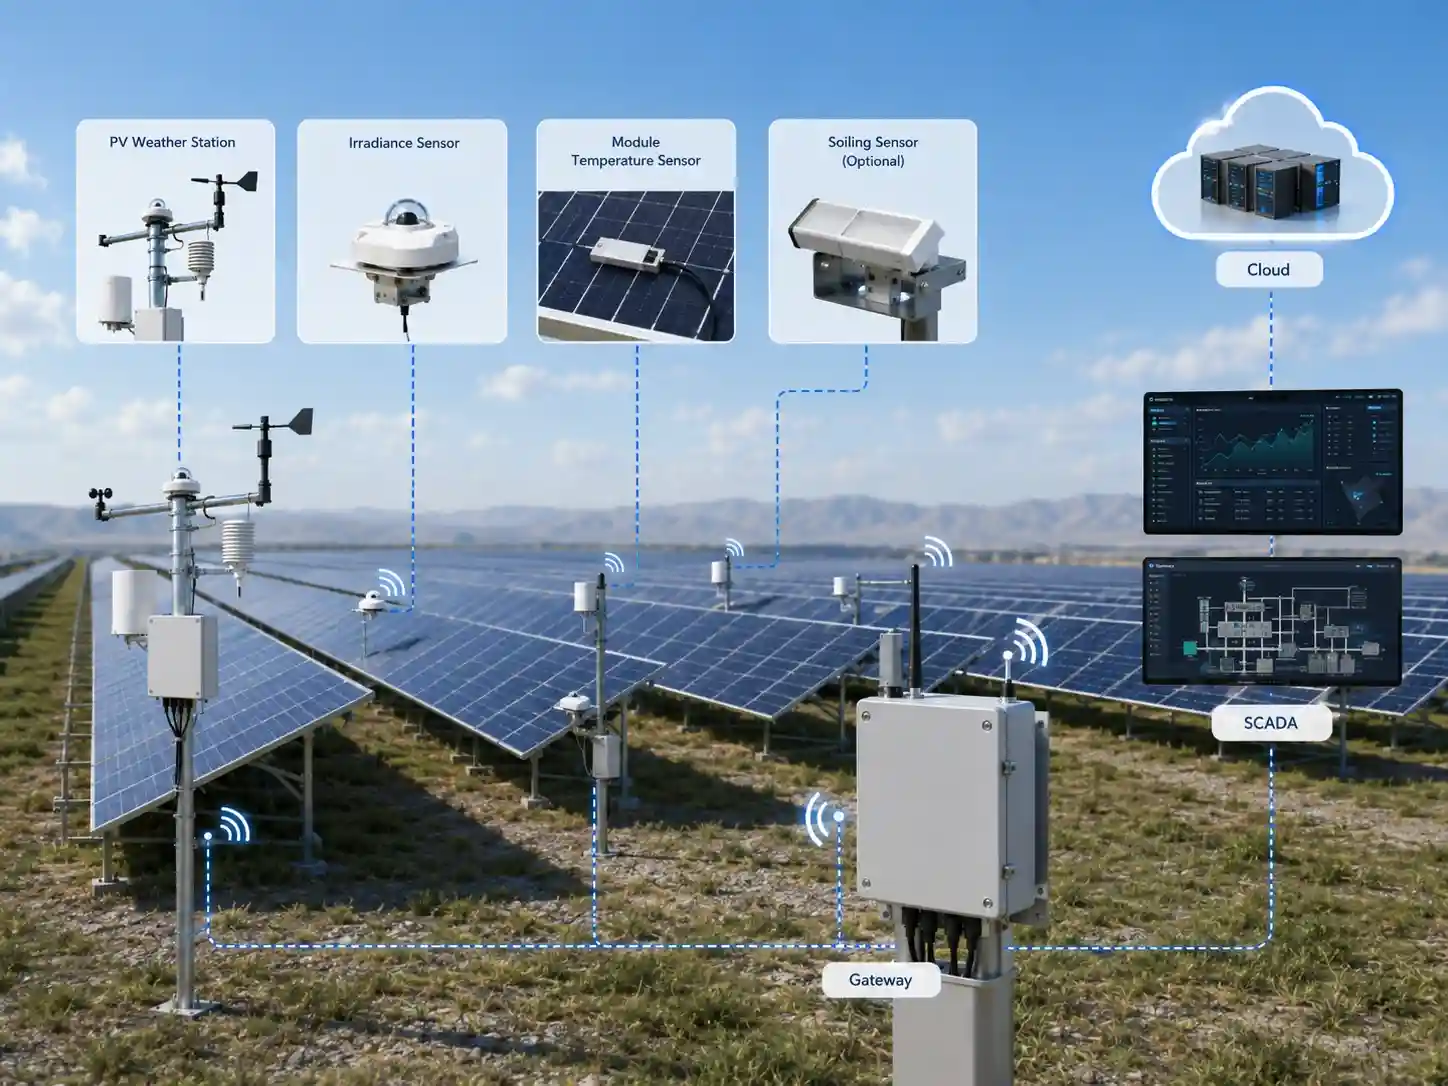
A practical system can be divided into four layers.
Layer 1: Environmental Measurement
A typical monitoring package may include:
- High-quality pyranometer or solar irradiance sensor
- POA irradiance measurement
- PV module temperature sensor
- Ambient temperature and humidity
- Wind speed and direction
- Rainfall
- Optional soiling monitoring
Layer 2: Data Acquisition
The data logger or IoT controller should collect sensor signals, timestamp measurements, store data when required, and prepare information for transmission.
Important considerations include:
- Supported sensor interfaces
- Number of channels
- Local data storage
- Data polling interval
- Power consumption
- Outdoor protection
- Remote diagnostics
Layer 3: Communication
Depending on the project:
- RS485 Modbus can support local industrial networks.
- Ethernet can connect stations to existing plant infrastructure.
- LoRaWAN can support distributed monitoring points across a large site.
- 4G LTE can support remote sites or independent communication.
- MQTT/API can support integration with third-party platforms.
Layer 4: SCADA or Cloud Platform
The final layer should allow operators to view environmental data together with plant performance information.
Useful functions may include:
- Real-time dashboards
- Historical trends
- Irradiance vs. generation comparison
- Performance alarms
- Multi-zone comparison
- Data export
- API integration
- Device status monitoring
The key principle is to design the monitoring system as one complete data chain rather than as a collection of independent sensors.
What Should EPCs and System Integrators Confirm Before Selecting a PV Weather Station?
Before requesting a quotation, it is useful to define several project requirements.
Plant Information
- Installed PV capacity
- Site area
- Location and climate
- Fixed-tilt or tracker system
- Number of inverter or monitoring zones
Measurement Requirements
- GHI or POA irradiance
- Pyranometer accuracy requirements
- Number of irradiance points
- Module temperature points
- Wind and rainfall monitoring
- Soiling monitoring requirements
Communication Requirements
- RS485 / Modbus
- Ethernet
- LoRaWAN
- 4G
- MQTT
- HTTP
- API
Platform Requirements
- Existing SCADA system
- Data format
- Required update interval
- Historical storage
- Alarm requirements
- Remote access
- Third-party platform integration
Providing this information during system design makes it easier to select an appropriate configuration and prevents unnecessary hardware changes during commissioning.
PV Weather Station vs. Regional Weather Data: What Is the Difference?
Regional meteorological data is valuable for forecasting and broader climate analysis.
A PV weather station serves a different purpose.
It measures environmental conditions at or near the photovoltaic arrays, allowing operators to compare local solar resource conditions directly with plant performance.
For utility-scale solar farms, the question is therefore not whether public weather data is useful.
It is.
The more important question is whether that data is sufficiently representative for plant-level performance diagnosis.
When operators need to evaluate the relationship between sunlight, module conditions, local weather, and actual electrical output, on-site measurements provide a much stronger reference.
FAQ
1. What is a PV weather station?
A PV weather station is an environmental monitoring system designed for photovoltaic projects. It typically measures solar irradiance and may also monitor module temperature, ambient temperature, humidity, wind, rainfall, and other site conditions. The data is used for PV performance analysis, O&M, and solar resource monitoring.
2. Why is irradiance measurement important for a solar farm?
Irradiance represents the solar energy available to the PV array. Comparing irradiance with actual power generation helps operators determine whether lower output is primarily caused by reduced sunlight or potentially by plant performance problems.
3. What is the most important measurement for PV performance monitoring?
Solar irradiance is one of the most important measurements, but it should normally be evaluated together with module temperature and electrical production data. Large plants may also require wind, rainfall, soiling, and multiple distributed irradiance measurements.
4. Can a PV weather station connect to an existing SCADA system?
Yes, provided the interfaces and communication architecture are compatible. Depending on the system design, PV weather stations and data loggers can use industrial communication methods such as RS485 Modbus, Ethernet, 4G, LoRaWAN, MQTT, HTTP, or API-based integration.
5. How many weather stations does a utility-scale solar farm need?
There is no universal number. It depends on plant size, terrain, array layout, local weather variability, monitoring standards, and performance analysis requirements. Large sites may use a central weather station together with additional distributed irradiance and module temperature monitoring points.
6. Can weather data identify a faulty inverter?
Weather data alone normally does not identify a specific inverter failure. However, if irradiance remains high while generation from one area drops unexpectedly, environmental data helps operators distinguish weather-related generation loss from a potential electrical or equipment issue.
7. How can PV weather data reduce maintenance costs?
Environmental and performance data can help maintenance teams prioritize inspections, identify abnormal generation earlier, evaluate soiling conditions, analyze weather-related events, and avoid unnecessary maintenance triggered only by unexplained output changes.
8. What communication method is best for a large solar farm?
The best method depends on the site’s infrastructure. RS485 and Ethernet can work well where wired infrastructure is available, while LoRaWAN can be useful for distributed monitoring points and 4G can support remote installations. Large projects may use several communication technologies together.
From Weather Data to Better Solar Farm Decisions
The value of a PV weather station does not come from collecting more environmental parameters.
Its real value comes from connecting environmental conditions with plant performance.
For a utility scale solar farm, that means knowing not only how much electricity was generated, but also how much solar resource was available, what environmental conditions the modules experienced, and whether the actual output was reasonable under those conditions.
When irradiance, module temperature, wind, rainfall, electrical generation, and equipment data are brought together in the same monitoring environment, PV operators gain a clearer basis for:
- Performance analysis
- Fault investigation
- Cleaning decisions
- Preventive maintenance
- Multi-zone comparison
- SCADA alarms
- Long-term output optimization
For EPC companies, solar developers, O&M teams, and system integrators, the best PV weather monitoring system is therefore not simply the station with the largest number of sensors.
It is the system that provides representative measurements, reliable data acquisition, stable communication, and straightforward integration with the plant’s existing monitoring architecture.
Get a Utility Scale PV Monitoring Plan
Planning a new solar farm or upgrading an existing PV monitoring system?
JW-IoT can provide project-based configurations covering:
- PV weather stations
- Solar irradiance monitoring
- PV module temperature monitoring
- Wind and rainfall monitoring
- Distributed monitoring points
- Data loggers and IoT nodes
- LoRaWAN / 4G / RS485 / Ethernet communication
- Cloud platform and SCADA integration
Get Utility Scale PV Monitoring Plan
When requesting a configuration, provide your plant capacity, site size, required monitoring parameters, communication method, and SCADA or platform requirements so the monitoring architecture can be designed around the actual project.