+86 13520127780
  info@jingelway.com








Menggunakan Data Radiasi Matahari dan Suhu untuk Memaksimalkan Rasio Kinerja PV
Release time: 2026-09-06
For a photovoltaic power plant, total energy generation does not always tell the full story.
A plant may generate more electricity on one day simply because more solar energy was available. On another day, production may decrease because irradiance was lower even though the PV system itself was operating normally.
Inilah alasannya Performance Ratio, or PR, is widely used to evaluate PV plant performance.
PR relates the energy produced by the PV system to the solar energy available to it. However, irradiance alone does not explain every change in PR.
PV module temperature also matters.
A high-irradiance summer day may expose the modules to excellent solar conditions while elevated operating temperatures reduce electrical efficiency. If temperature is ignored, part of this normal thermal effect may appear as a performance loss.
For useful PV performance analysis, operators therefore need to understand the relationship between three sets of data:
Solar Irradiance → Module Temperature → Electrical Output
This article explains how combining solar irradiance and temperature data can make PR analysis more meaningful and help PV operators distinguish weather-related variation from actual system underperformance.
1. What Does Performance Ratio Actually Tell a PV Operator?
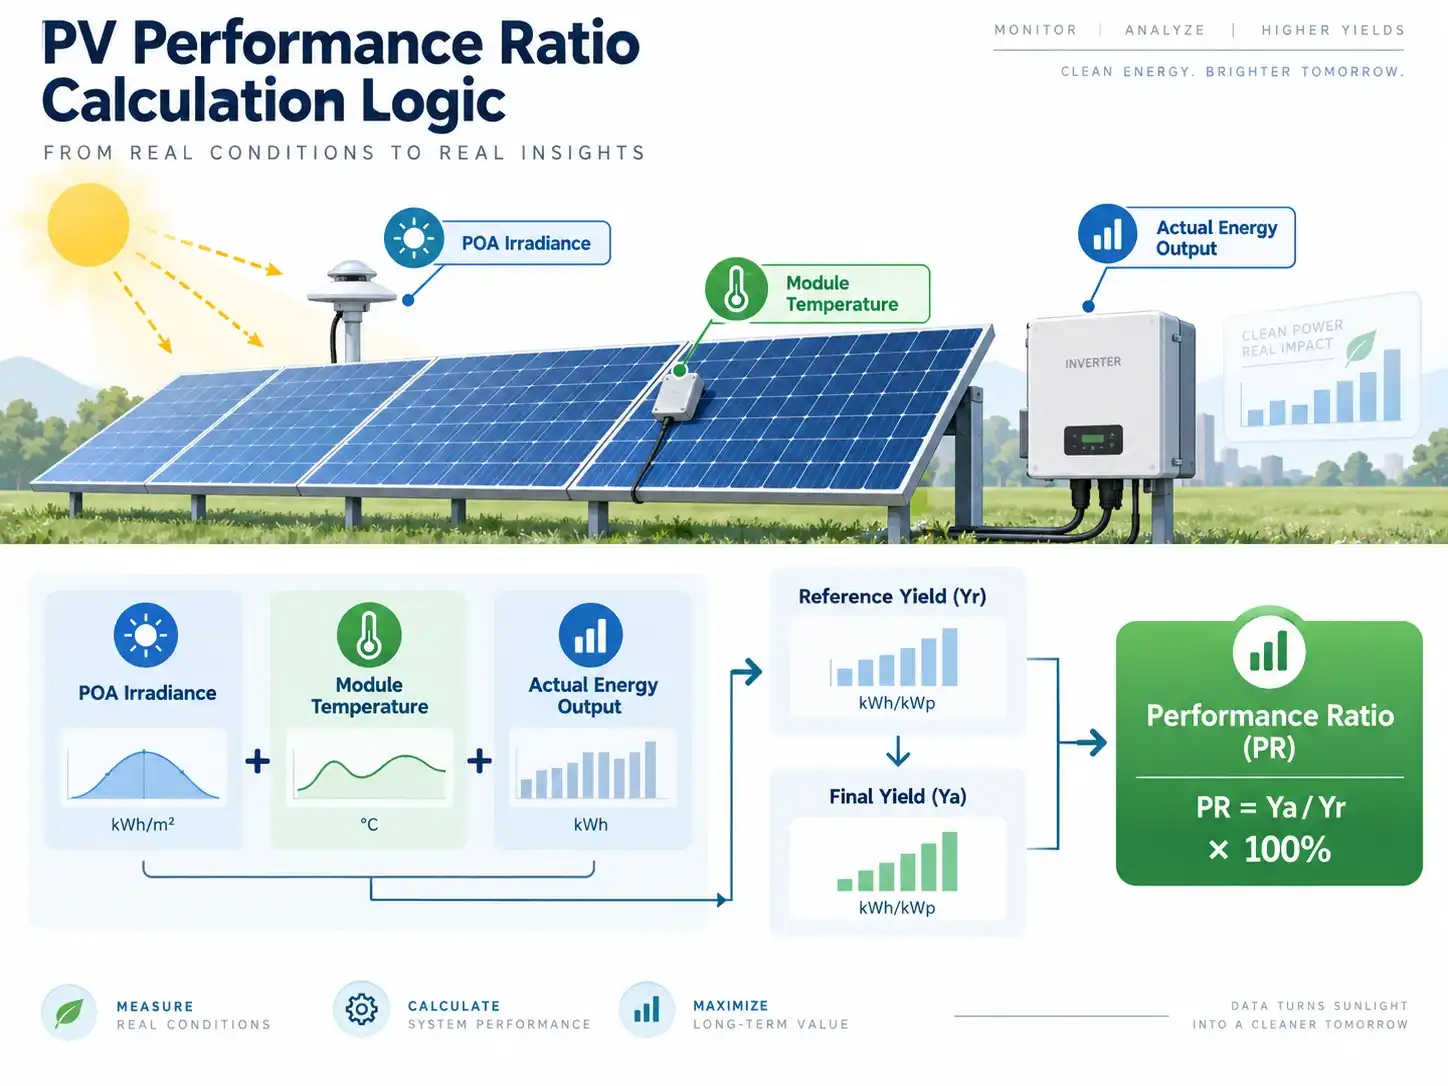
Performance Ratio is a normalized indicator used to assess how effectively a PV plant converts the available solar resource into electrical energy.
In simplified form:
PR = Final System Yield / Reference Yield
The final yield represents the energy produced relative to the installed PV capacity.
The reference yield represents the solar irradiation received by the PV array relative to a standard reference irradiance.
Unlike total generation, PR makes it possible to compare system performance under different solar conditions.
For example, consider two operating days:
| Day | Solar Resource | Energy Production | What Production Alone Suggests |
| Day A | Tinggi | 90 MWh | Bagus |
| Day B | Lebih rendah | 75 MWh | Worse |
Looking only at electricity generation, Day A appears better.
But if Day A received significantly more irradiance, the PV system may actually have converted the available solar energy less efficiently than it did on Day B.
PR helps normalize this difference.
For O&M teams, this makes PR useful for:
- identifying unexpected performance changes;
- comparing different operating periods;
- comparing different sections of a PV plant;
- evaluating performance before and after maintenance;
- and tracking long-term system behavior.
However, PR still needs to be interpreted carefully because it is influenced by operating temperature and other environmental conditions.
2. The Three-Data Relationship Behind Better PR Analysis
A useful way to understand PV performance is to divide monitoring data into three layers.
Solar Irradiance: Available Energy
Irradiance answers:
How much solar energy was available to the PV modules?
Without this reference, reduced electricity generation cannot be properly interpreted.
Module Temperature: Operating Condition
Module temperature answers:
Under what thermal condition were the PV modules converting that energy?
Solar modules normally become hotter as solar irradiance increases.
For many PV technologies, higher cell temperature reduces maximum power output relative to the same irradiance at a lower operating temperature.
Electrical Output: Actual Response
Inverter or meter data answers:
How much electrical energy did the PV plant actually produce?
PR analysis becomes much more useful when these three variables are examined together.
Conceptually:
Available Solar Resource
↓
Module Operating Temperature
↓
Expected Electrical Response
↓
Actual Electrical Response
↓
Performance Evaluation
The key question is therefore not simply:
“Did PV output decrease?”
It is:
“Did PV output decrease more than would reasonably be expected from the measured irradiance and module temperature?”
That is a much stronger basis for fault diagnosis.
3. Why PR Can Change Even When the PV Plant Has No Fault
One of the most important limitations of standard PR is that it is sensitive to temperature.
A PV plant can therefore show seasonal PR variation even when its equipment condition has not changed significantly.
Consider a simplified example.
Suppose two clear days have similar plane-of-array irradiance.
On the cooler day:
- POA irradiance is high;
- module temperature remains moderate;
- electrical conversion efficiency is relatively favorable.
On the hotter day:
- POA irradiance remains similarly high;
- module temperature increases significantly;
- PV power may be lower because of the module temperature effect.
The result may be a lower standard PR on the hotter day.
This does not automatically mean that the plant has developed a fault.
It may partly reflect normal temperature-dependent module behavior.
This distinction becomes especially important when comparing:
- winter and summer PR;
- morning and afternoon performance;
- desert and temperate PV sites;
- ventilated ground-mounted arrays and hot rooftop arrays.
For this reason, environmental data should be used to interpret PR rather than treating every PR decline as an equipment problem.
4. How Module Temperature Influences PV Output
PV modules are rated under standardized laboratory conditions, including a reference cell temperature.
Actual operating temperatures in the field can be considerably different.
When module temperature rises above the reference condition, maximum power output generally decreases according to the module’s specified power temperature coefficient.
A simplified relationship is:
P(T) = P₍ref₎ × [1 + γ × (Tmodule − Tref)]
Di mana:
- P(T) = power under the measured temperature condition;
- P₍ref₎ = reference power;
- γ = power temperature coefficient supplied by the module manufacturer;
- Tmodule = measured module temperature;
- Tref = reference temperature.
The coefficient should always come from the specific PV module manufacturer’s technical documentation rather than from a generic assumed value.
This is important because different module technologies and products can have different thermal characteristics.
The purpose of the module temperature sensor is therefore not merely to show that a panel is “hot.”
Its value is that the temperature measurement provides context for determining whether reduced output is consistent with expected thermal behavior.
5. How to Read Irradiance, Temperature and Output Together
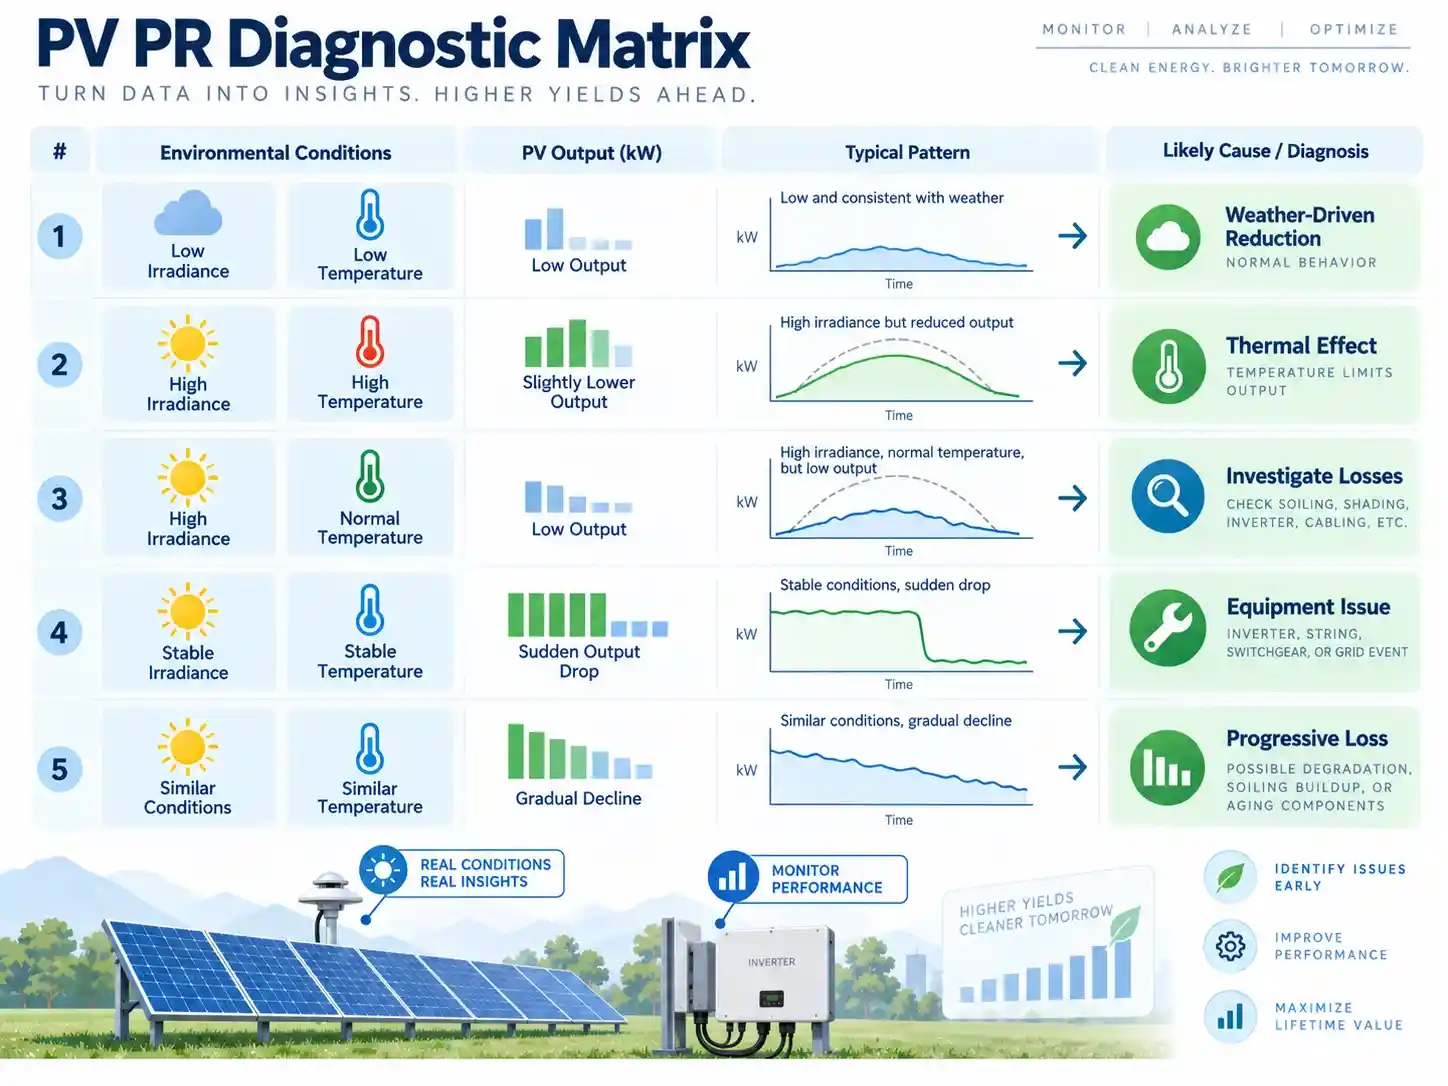
The most useful PR monitoring approach is based on data correlation.
A simple diagnostic matrix can help.
| Intensitas radiasi | Suhu Modul | PV Output | Initial Interpretation |
| Rendah | Normal | Rendah | Likely solar-resource-driven reduction |
| Tinggi | Sedang | Tinggi | Normal strong-generation condition |
| Tinggi | Sangat Tinggi | Slightly Lower Than Expected | Thermal effect may contribute |
| Tinggi | Normal | Clearly Low | Investigate non-weather system losses |
| Stable | Stable | Sudden Drop | Equipment or electrical issue may require inspection |
| Similar over time | Serupa | Gradual Decline | Investigate progressive losses |
This matrix is not intended to replace detailed engineering analysis.
Instead, it helps operators determine where to investigate first.
6. Scenario 1: Low Output Caused by Low Solar Resource
Suppose inverter output declines significantly during part of the day.
The first step should be to check irradiance.
If POA irradiance falls at approximately the same time and PV output follows a similar pattern, the generation change may simply be caused by:
- cloud cover;
- haze;
- changing sun angle;
- or other solar-resource conditions.
In this situation, reduced energy production does not necessarily indicate poor equipment performance.
This illustrates why generation alarms without environmental context can create unnecessary investigations.
7. Scenario 2: High Irradiance but Elevated Module Temperature
Another pattern may occur during hot, clear afternoons.
Measured conditions show:
- strong POA irradiance;
- high PV module temperature;
- output increasing less than expected.
If the reduction is consistent with the module’s thermal characteristics, elevated temperature may explain part of the difference.
This is one reason standard PR frequently exhibits seasonal variation.
A summer PR value should therefore not always be compared directly with a winter PR value without considering the corresponding module temperature.
For sites experiencing strong seasonal temperature changes, temperature-aware analysis can make long-term comparisons more meaningful.
8. Scenario 3: High Irradiance, Normal Temperature and Low Output
This is a more important condition for maintenance teams.
Suppose:
- POA irradiance is strong;
- module temperature is within the expected range;
- but electrical output is noticeably below historical or modeled expectations.
Temperature is less likely to explain the entire loss.
Further investigation may then focus on plant-side factors such as:
- soiling;
- localized shading;
- unavailable strings;
- DC connection issues;
- inverter derating;
- inverter faults;
- tracker misalignment;
- curtailment;
- or other electrical losses.
The environmental monitoring system does not identify every fault directly.
Instead, it helps rule out environmental explanations and directs attention toward equipment or operational causes.
9. Scenario 4: Stable Environmental Conditions but Sudden Output Loss
Short-term anomalies are often easier to identify when irradiance and module temperature remain stable.
Consider this pattern:
POA irradiance: stable
Module temperature: stable
One inverter output: sudden decrease
Because the environmental input has not changed significantly, the probability of an equipment-side event becomes greater.
The O&M team can then review:
- inverter alarm history;
- string current;
- DC voltage;
- grid conditions;
- communication status;
- and maintenance records.
This is why environmental monitoring becomes more valuable when it is compared with inverter and electricity-meter data rather than viewed as an isolated weather dataset.
10. Scenario 5: Gradual PR Decline Over Time
Not every PR problem appears as a sudden alarm.
Some losses develop gradually.
Misalnya:
Week 1: normal PR
Week 2: slightly lower
Week 3: lower again
Week 4: noticeable deviation
If comparable irradiance and temperature conditions are selected, this trend may justify further investigation.
Possible factors can include:
- increasing soiling;
- vegetation growth;
- progressive shading;
- module degradation;
- sensor drift;
- electrical deterioration;
- or changes in equipment availability.
A single low PR value provides limited information.
A consistent trend under comparable environmental conditions is far more meaningful.
That is why historical data quality is essential for PV O&M.
11. Standard PR vs Temperature-Corrected PR
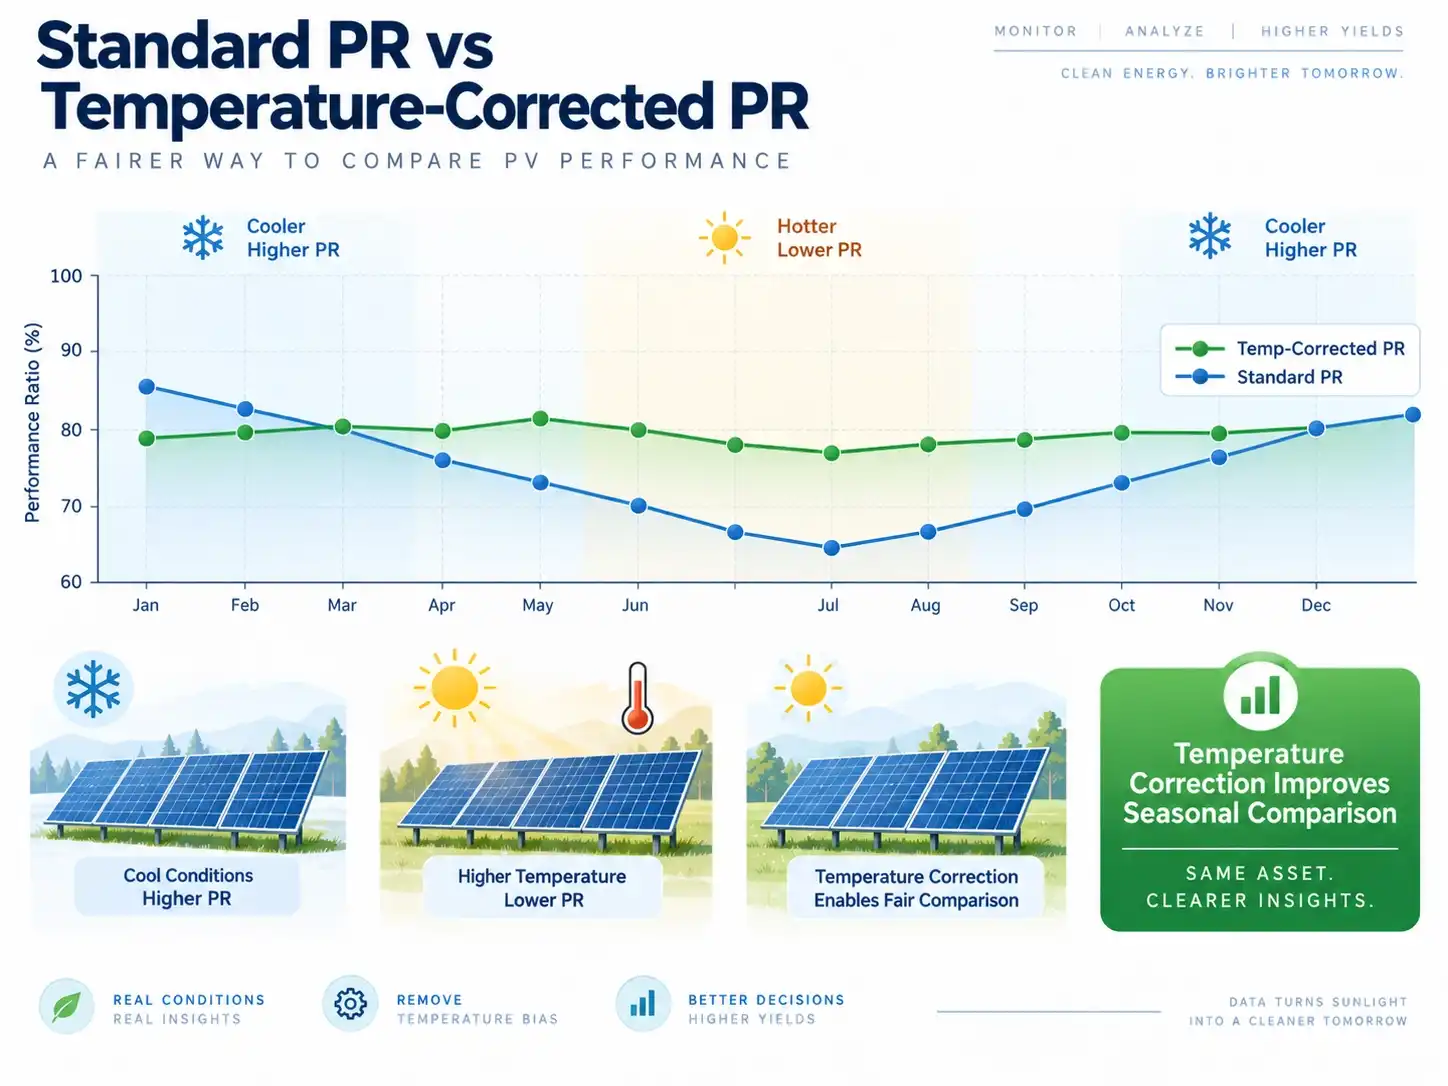
Standard PR is useful, but module temperature introduces seasonal variability.
For more detailed analysis, operators may use a temperature-corrected performance ratio.
The objective is not to artificially improve the PR value.
The purpose is to estimate system performance after reducing the influence of module operating temperature.
Conceptually:
Standard PR
compares:
actual yield / irradiance-based reference yield
while:
Temperature-Corrected PR
adds a correction based on:
- measured module temperature;
- a reference temperature;
- and the module manufacturer’s power temperature coefficient.
This provides a better basis for determining whether changes in PR are caused mainly by temperature or by other plant losses.
Temperature-corrected analysis can be particularly useful for:
- seasonal performance comparison;
- hot-climate PV plants;
- long-term performance trending;
- evaluating maintenance results;
- and diagnosing underperforming arrays.
However, the temperature correction must use an appropriate methodology and correct module parameters.
A monitoring sensor provides the required field measurements; the final PR methodology should follow the plant owner’s analytical or reporting requirements.
12. Why Temperature Correction Matters for Seasonal Comparison
Imagine a PV plant operating normally throughout the year.
Its monthly standard PR might still follow a pattern such as:
Cooler season → higher PR
Hotter season → lower PR
If the operator interprets every summer decrease as system degradation, maintenance decisions may be misleading.
By accounting for module temperature, the operator can ask a better question:
“After removing part of the expected thermal effect, is the plant still performing worse than before?”
If the answer is yes, further investigation becomes more justified.
This makes temperature-corrected PR particularly valuable for trend interpretation, rather than simply producing another dashboard number.
13. The Importance of Plane-of-Array Irradiance for PR
For PR analysis, the irradiance measurement should represent the solar resource received by the PV array.
Inilah alasannya Plane-of-Array (POA) irradiance is commonly used.
POA irradiance is measured in the same plane as the photovoltaic modules.
This is particularly relevant because module tilt and orientation determine how much solar radiation reaches the active PV surface.
A mismatch between the irradiance measurement plane and the PV array may reduce the usefulness of the data for performance comparison.
For PV plants that contain different:
- orientations;
- tilt angles;
- tracker blocks;
- terrain conditions;
- or array configurations,
multiple representative irradiance monitoring points may be required.
The objective is not simply to install more sensors.
It is to make sure the measured reference actually represents the section of the plant being evaluated.
14. Why Module Temperature Sensor Placement Matters
Temperature data is only useful if the measurement represents actual module operating conditions.
PV module temperature sensors are typically installed on the rear surface of representative modules.
Good installation should focus on:
- stable thermal contact;
- representative module selection;
- appropriate attachment;
- protection of the cable and sensor;
- and avoiding unusual localized conditions.
For a large plant, one temperature measurement may not represent every section equally.
Different module temperatures can result from:
- wind exposure;
- mounting configuration;
- terrain;
- roof ventilation;
- array position;
- and different operating conditions.
Where thermal variation across the plant is significant, multiple temperature monitoring points can improve performance interpretation.
15. Time Alignment Can Affect PR Diagnosis
Even accurate sensors can produce misleading conclusions if the datasets are not synchronized.
Imagine:
- irradiance recorded as a 10-minute average;
- module temperature recorded every minute;
- inverter power recorded instantaneously at a different timestamp.
Direct comparison between these values can create apparent performance anomalies that are actually caused by mismatched data intervals.
A reliable PR dataset should therefore consider:
- timestamp synchronization;
- sampling interval;
- averaging period;
- missing-data handling;
- communication gaps;
- and sensor status.
This becomes especially important during rapidly changing cloud conditions, when irradiance can change much faster than module temperature.
Good PR analysis depends not only on sensor accuracy, but also on data consistency.
16. A Practical PR Diagnostic Workflow
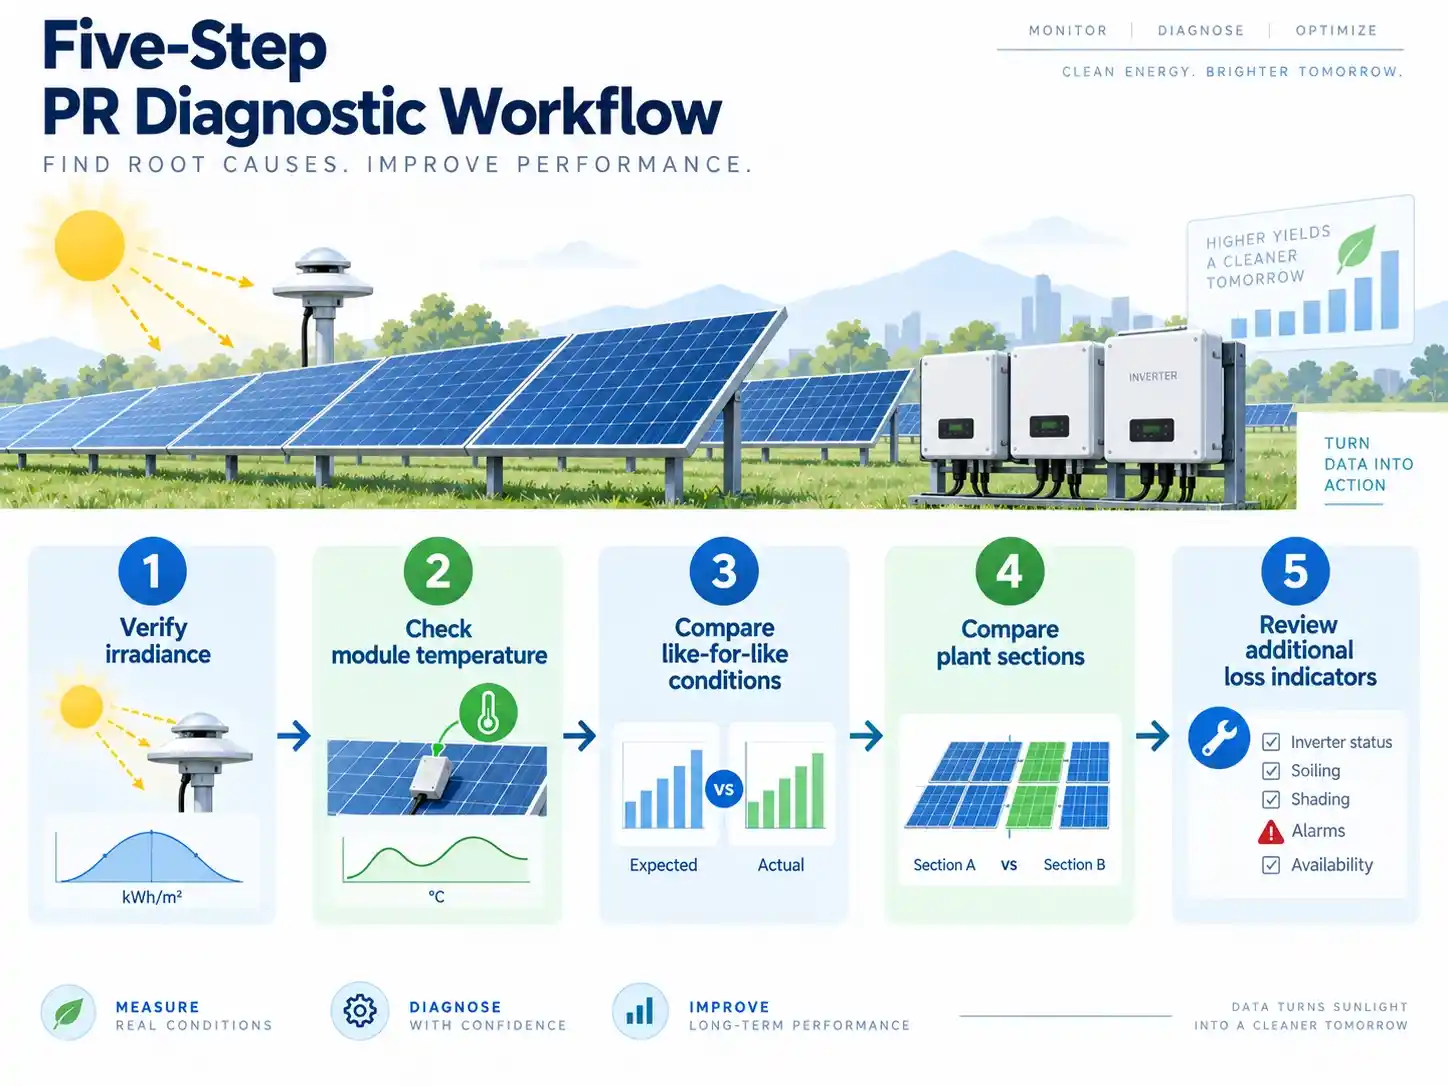
PV O&M teams can use the following workflow when PR falls unexpectedly.
Step 1: Verify Irradiance
Check whether the measured solar resource decreased.
If irradiance explains the generation reduction, there may be no abnormal plant loss.
Step 2: Check Module Temperature
Determine whether the modules were operating significantly hotter than during the comparison period.
Evaluate the possible temperature effect using the module manufacturer’s temperature coefficient.
Step 3: Compare Like-for-Like Conditions
Avoid comparing unrelated operating periods.
Where possible, compare data with similar:
- irradiance levels;
- module temperatures;
- time of day;
- seasonal conditions;
- and array configuration.
Step 4: Compare Different Plant Sections
Look at:
- inverter-to-inverter performance;
- zone-to-zone performance;
- array-to-array performance;
- or tracker-block performance.
If environmental conditions are similar but one section performs worse, local inspection becomes more targeted.
Step 5: Review Additional Loss Indicators
If irradiance and temperature do not explain the PR decline, review:
- soiling data;
- inverter status;
- tracker position;
- string data;
- grid curtailment;
- alarms;
- maintenance history;
- and weather events.
This workflow turns PR from a reporting KPI into a practical diagnostic tool.
17. What Data Is Needed for Effective PR Analysis?
A practical PV PR monitoring dataset may include:
Core measurements
Intensitas Radiasi Bidang Susunan
Provides the reference solar resource received by the PV modules.
Suhu Modul PV
Provides the thermal condition required to interpret temperature-related efficiency changes.
Electrical Energy or Power
Obtained from the inverter, smart meter or plant monitoring system.
Installed PV Capacity
Required for normalized performance calculations.
Additional contextual measurements
Depending on the project, additional data can include:
- ambient temperature;
- wind speed;
- wind direction;
- rainfall;
- GHI;
- soiling;
- inverter operating status;
- tracker status;
- and grid availability.
Not every parameter is required for every PR calculation.
The correct monitoring configuration depends on the analytical objective of the plant.
18. Recommended JW-IoT Sensors for PR Monitoring
JW-IoT provides environmental monitoring components that can supply field data for PV performance analysis.
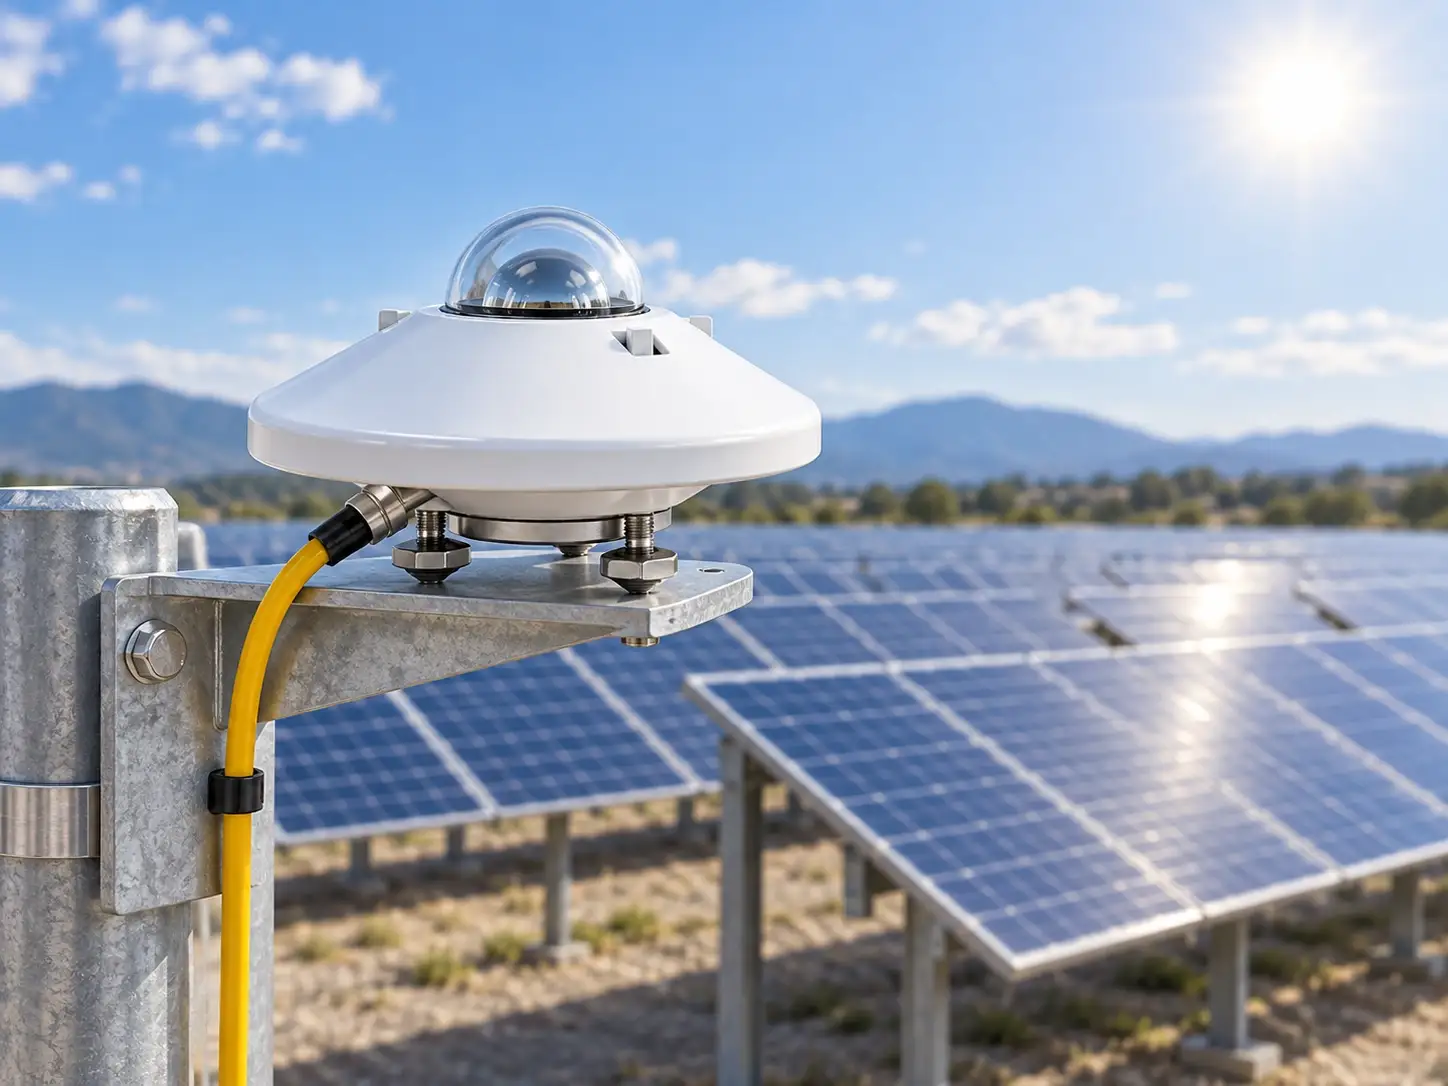
Pemantauan Radiasi Matahari
For PV performance analysis, irradiance measurement provides the reference solar input needed for PR evaluation.
JW-IoT offers solar radiation and irradiance monitoring products for PV applications.
Pemantauan Suhu Modul PV
Module backsheet temperature monitoring helps operators evaluate thermal operating conditions and interpret temperature-related performance changes.
Complete PV Environmental Monitoring
Projects requiring irradiance, module temperature and additional meteorological parameters can integrate these measurements into a larger PV monitoring system.
JW-IoT’s Solar PV Monitoring System supports environmental monitoring together with PV module temperature, inverter data and electricity-meter integration for performance analysis.
19. What Should a PR Monitoring Dashboard Show?
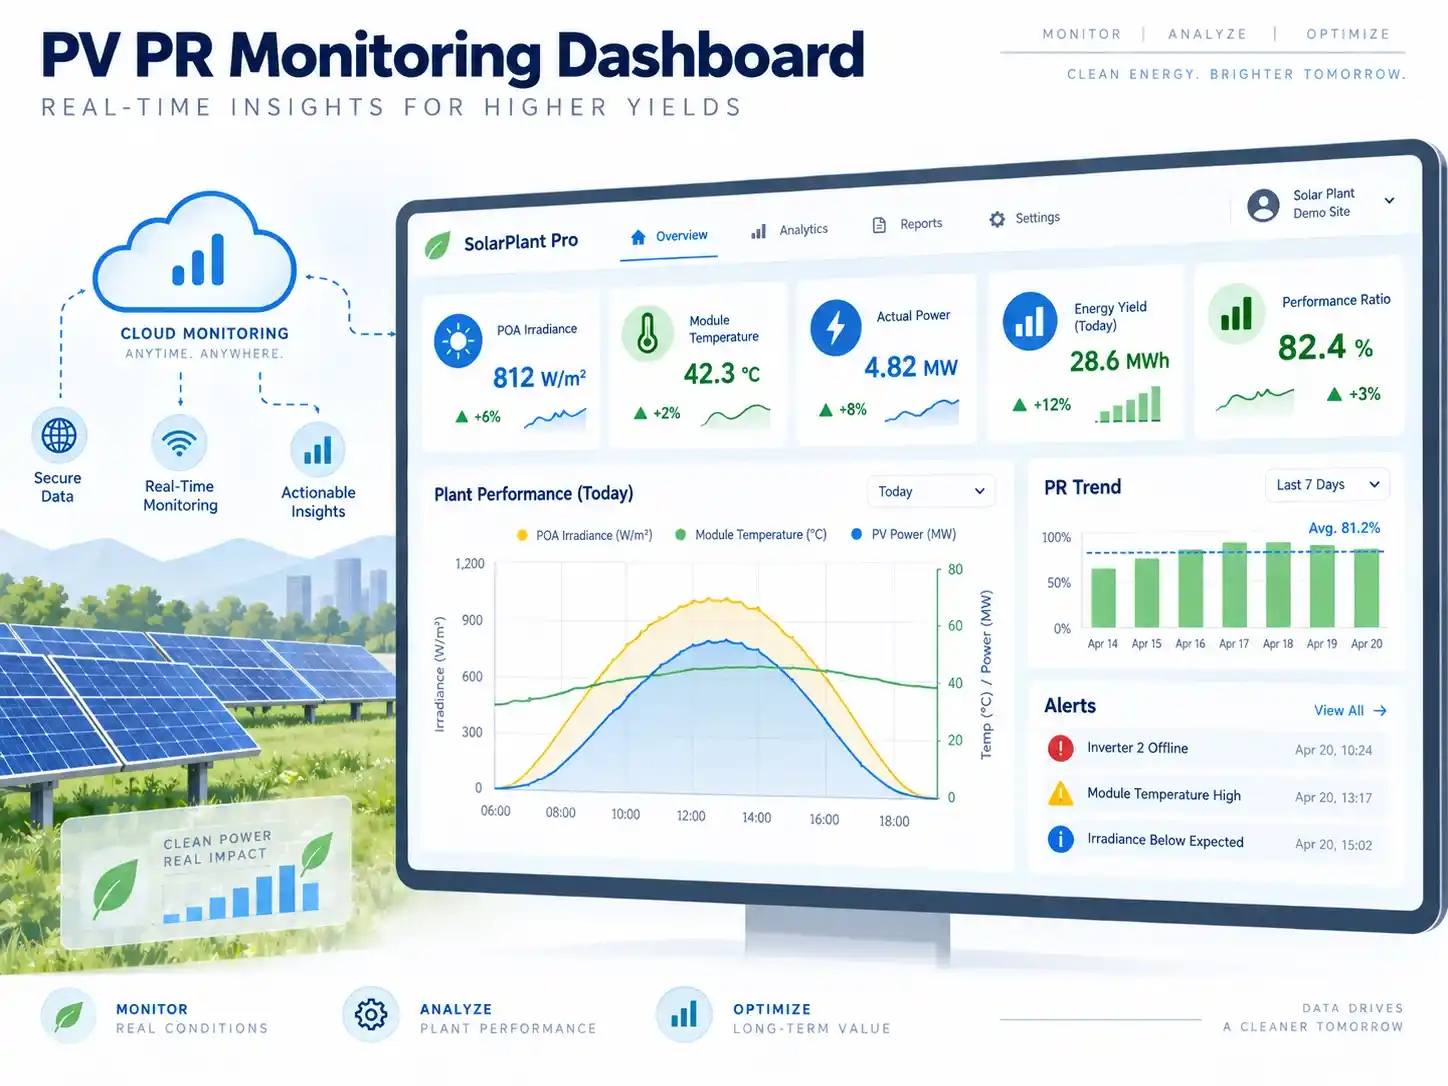
A useful PR dashboard should make relationships visible.
Rather than displaying isolated sensor values, it should allow operators to compare:
POA Irradiance
Suhu Modul PV
Actual Power
Energy Yield
PR Trend
on aligned time periods.
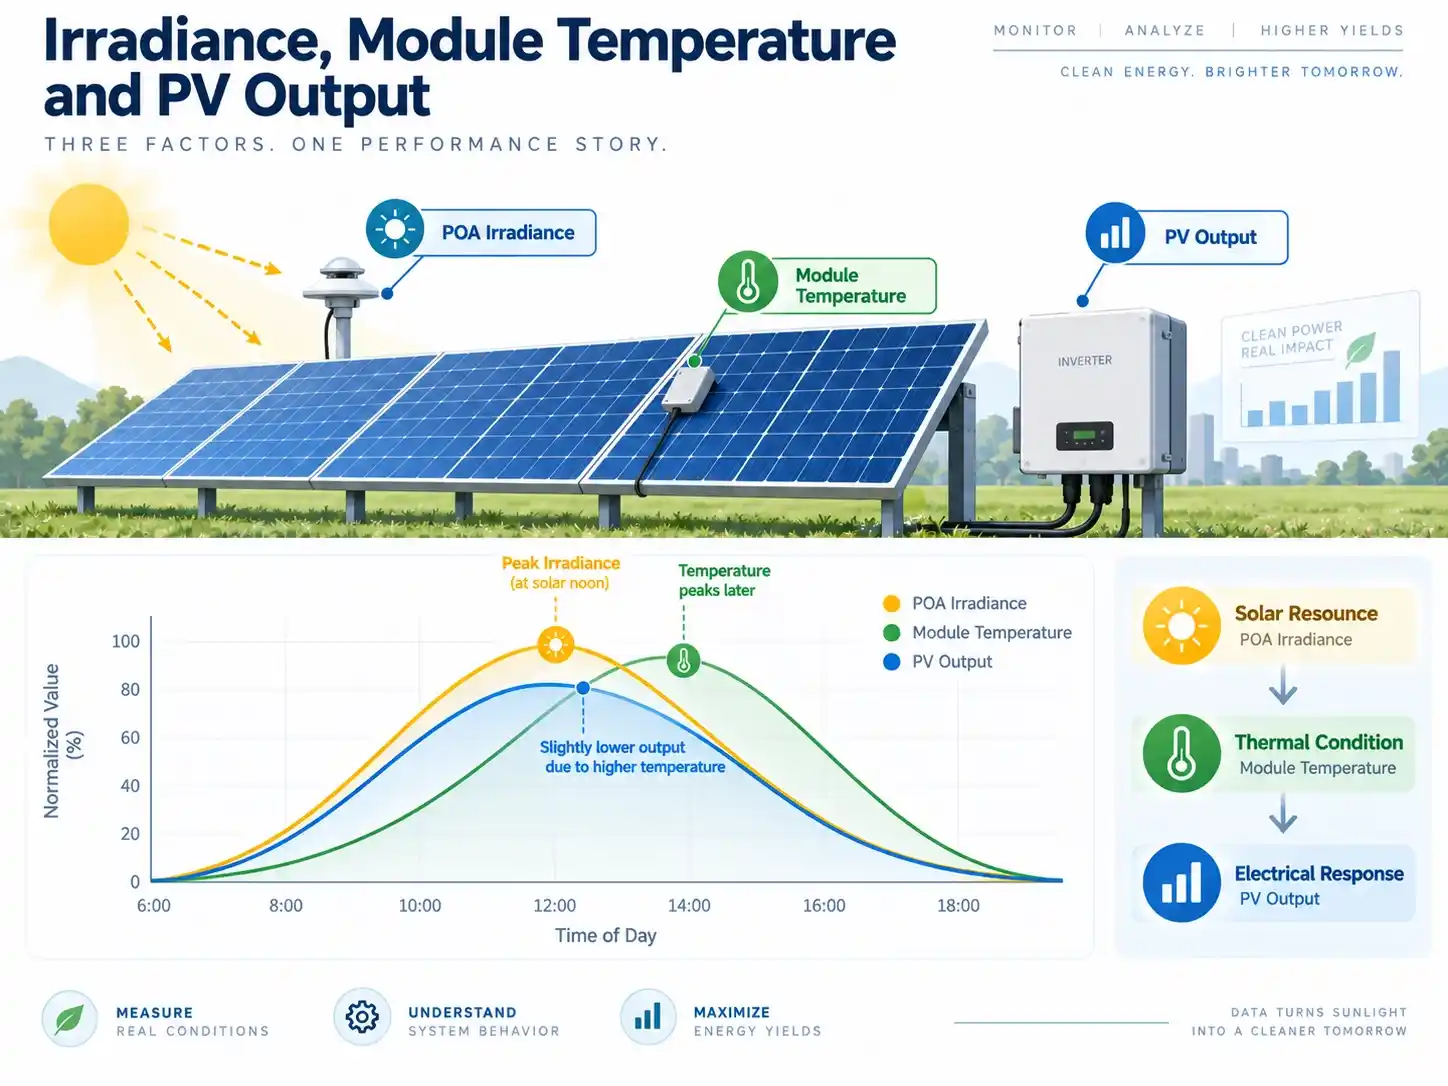
A useful visualization might show three curves:
Intensitas radiasi
↑
Suhu Modul
↑
PV Power Output
↑
When the curves behave normally, the relationship is easy to recognize.
When one curve begins to deviate from the others, operators have a starting point for diagnosis.
For long-term analysis, dashboards can also compare:
- daily PR;
- monthly PR;
- temperature-corrected performance;
- inverter groups;
- plant zones;
- and historical baseline periods.
The objective is not to generate more data.
It is to make the relationships between environmental conditions and plant performance easier to understand.
20. Five Questions to Ask When PR Drops
When an unexpected PR decline appears, start with five questions:
1. Did solar irradiance decrease?
If yes, reduced production may primarily reflect lower solar resource.
2. Did module temperature increase substantially?
If yes, part of the PR decline may be temperature-related.
3. Are irradiance and temperature measurements representative?
Incorrect installation, shading or sensor drift can affect the reference data itself.
4. Did all plant sections experience the same reduction?
If only one inverter or array block underperforms, investigate locally.
5. Does the anomaly remain after environmental effects are considered?
If yes, equipment, soiling, electrical or operational losses deserve further investigation.
This sequence prevents O&M teams from jumping directly from “low PR” to “equipment failure.”
Pertanyaan yang Sering Diajukan (FAQ)
1. What is Performance Ratio in a solar PV plant?
Performance Ratio is a normalized indicator comparing actual PV system yield with the reference yield derived from the solar irradiation available to the array. It allows system performance to be evaluated independently of total solar resource to a significant extent.
2. Why is solar irradiance needed for PR calculation?
Solar irradiance provides the reference input representing how much solar energy was available. Without irradiance data, low PV output cannot be reliably separated from low sunlight conditions.
3. Why does module temperature matter for PR?
PV module power changes with operating temperature. Elevated module temperatures can reduce power output and influence standard PR, particularly during hot seasons.
4. Is a low PR always a sign of a PV system fault?
No. PR can change because of temperature, solar conditions, curtailment and other operational factors. A low PR should be interpreted together with environmental and electrical data.
5. What is temperature-corrected PR?
Temperature-corrected PR adjusts performance analysis to reduce the effect of module operating temperature. It can provide a more useful basis for comparing plant performance across periods with different thermal conditions.
6. Which temperature coefficient should be used?
The temperature coefficient should be taken from the technical documentation of the specific PV module being evaluated.
7. Is POA irradiance better than GHI for PR analysis?
For array performance evaluation, POA irradiance is especially useful because it represents solar radiation received in the same plane as the PV modules. GHI remains valuable for broader meteorological and solar-resource monitoring.
8. How many irradiance and temperature sensors does a solar farm need?
There is no universal number. The monitoring design should account for plant size, array orientation, tracker zones, terrain, environmental variability and required monitoring accuracy.
Kesimpulan
A useful PV Performance Ratio is not just a number on a monthly report.
It is the result of understanding the relationship between:
the solar energy available,
the temperature at which the PV modules operate,
Dan
the electrical energy the plant actually produces.
Solar irradiance data establishes the resource reference.
Module temperature provides the thermal context.
Electrical output shows how the plant responded.
When these data streams are evaluated together, operators can distinguish normal environmental variation from conditions that deserve deeper investigation.
For O&M teams, this makes solar irradiance and temperature data an important foundation for more meaningful PR interpretation, better seasonal comparison and more targeted performance-loss diagnosis.
Get PR Monitoring Sensor Configuration
Planning a solar PV performance monitoring project?
JW-IoT can provide monitoring components for:
- Plane-of-Array irradiance measurement;
- solar radiation monitoring;
- PV module temperature monitoring;
- ambient weather monitoring;
- inverter and smart-meter data integration;
- and PV environmental monitoring applications.
Tell us your:
- PV plant capacity;
- fixed-tilt or tracker configuration;
- number of monitoring zones;
- required environmental parameters;
- data acquisition interface;
- and communication requirements.
Contact JW-IoT to get a PR Monitoring Sensor Configuration for your PV project.